Bitcoin (BTC) decreased on July 20 but bounced after creating a double bottom pattern.
This is a bullish pattern that often leads to upward movements. However, there are numerous resistances left to clear before the price can confirm a bullish reversal.
Bitcoin double bottom
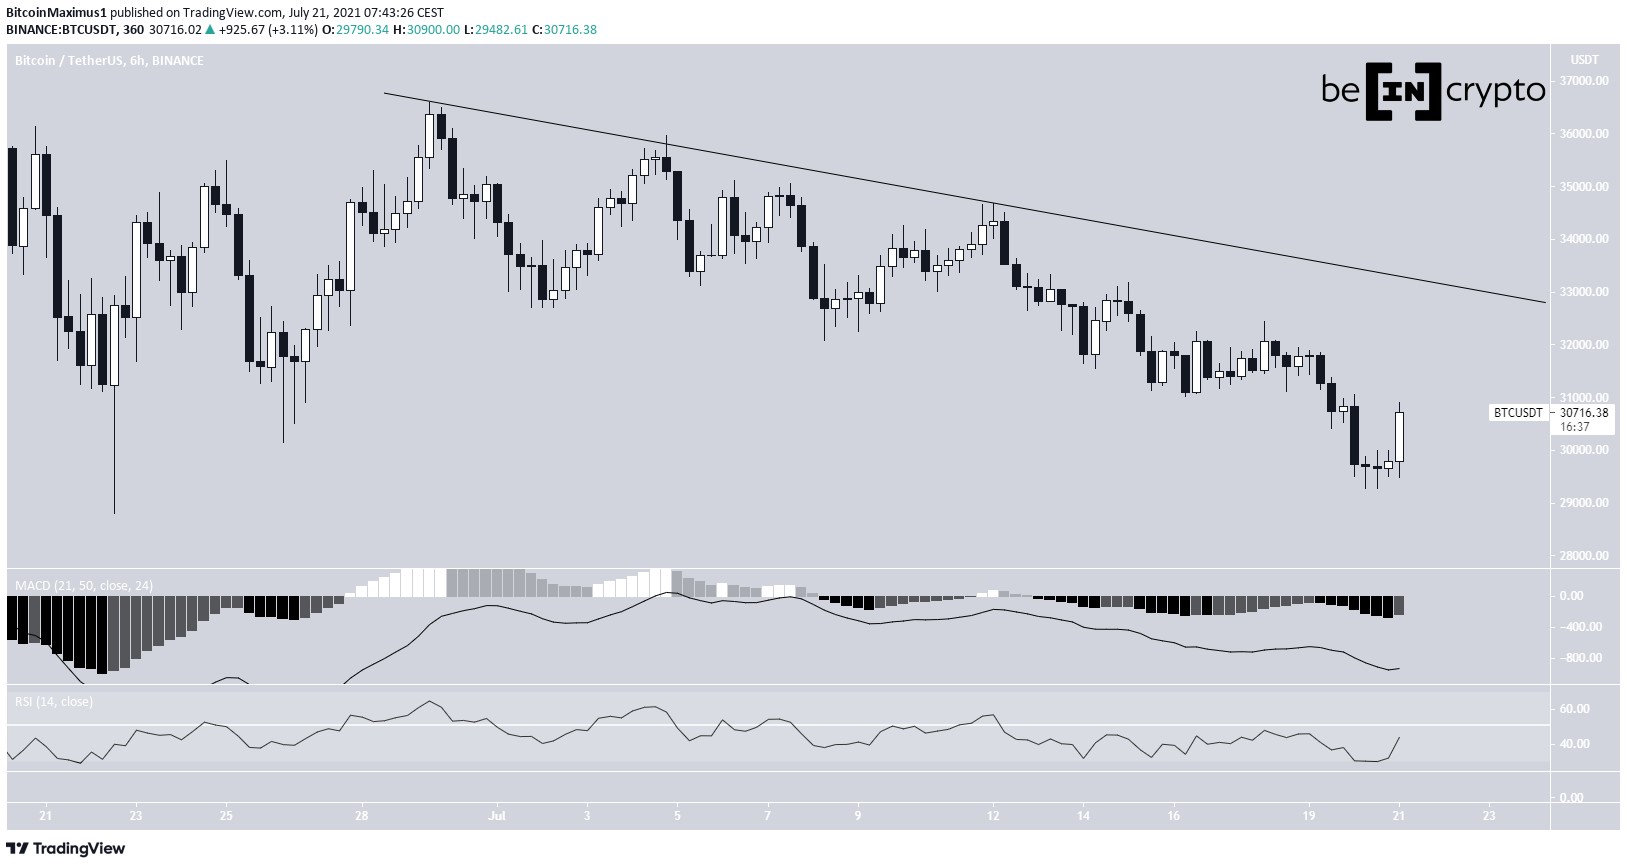
BTC has been decreasing alongside a descending resistance line since June 29. It was last rejected by the line on July 12.
On July 20, it fell to a low of $29,200, creating a double bottom pattern relative to the June 22 low. Following this, it increased and reached a high of $30,900.
However, technical indicators are still bearish. While both the RSI and MACD have shown bullish reversal signs, the former is below 50 while the latter is below 0.
BTC has to break out from the descending resistance line in order to confirm a reversal.
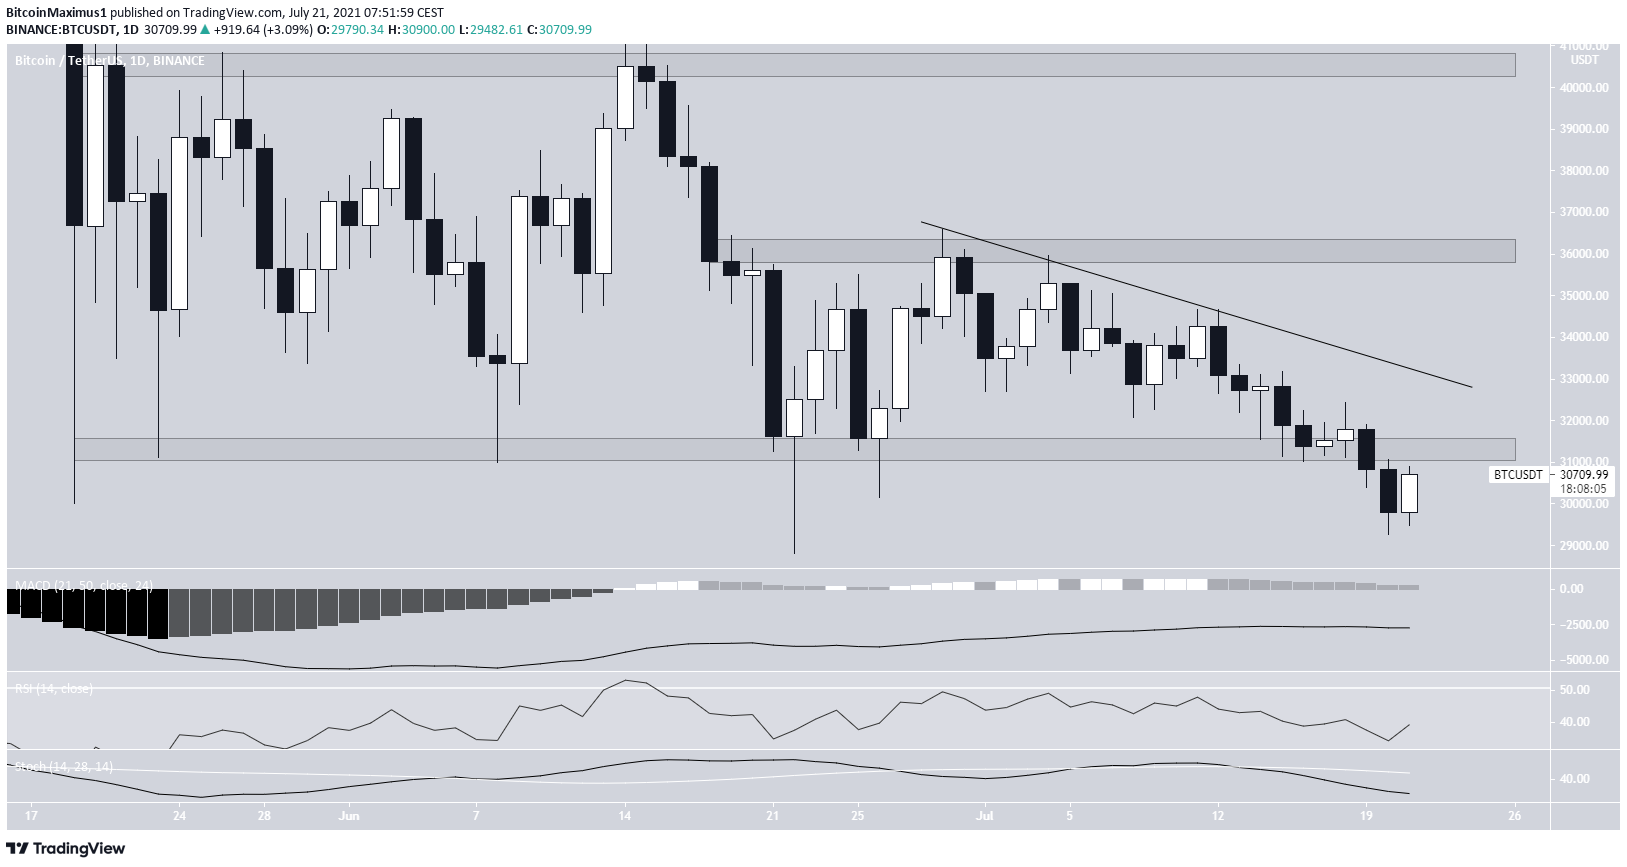
Similar to the six-hour time-frame, technical indicators in the daily time-frame are still bearish. The MACD is below 0, the RSI is below 50, and the Stochastic oscillator has made a bearish cross.
The first resistance area is found at $31,300. This is the previous support area of the range that has been in place since May 19.
If BTC is successful in moving above this level and then the descending resistance line, the next resistance area would be found at $36,000. This is a horizontal resistance area and the midline of the trading range.
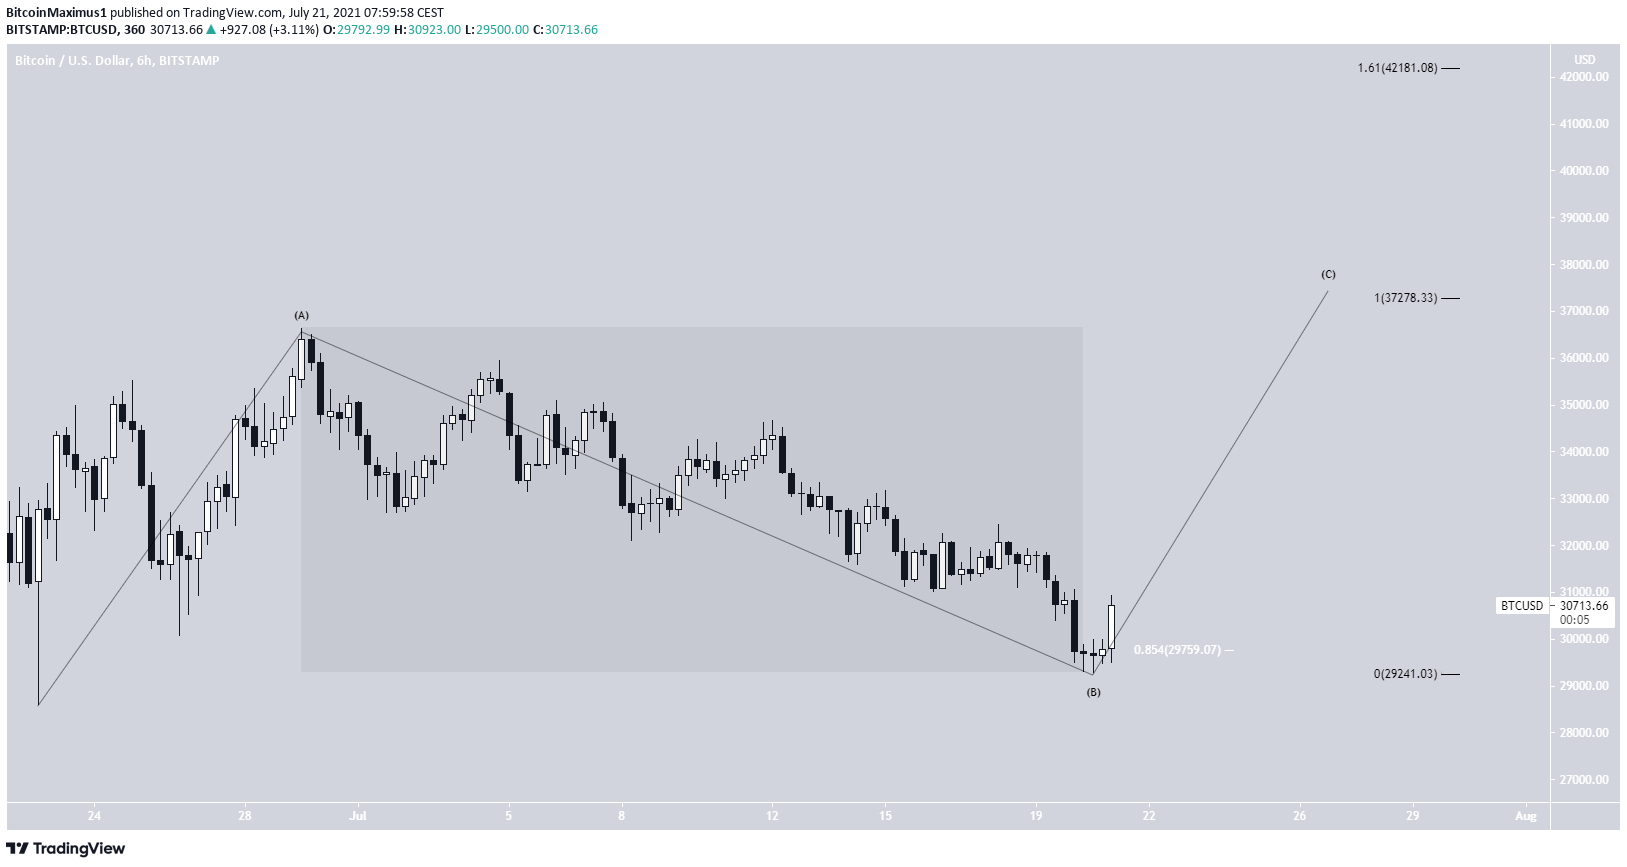
Wave count
The wave count suggests that BTC is in the C wave of a flat corrective structure. The main reason for this is that the preceding decrease is gradual and choppy, indicating that it’s likely a corrective structure instead of being a bearish impulse.
BTC has retraced more than the 0.85 Fib retracement support level (white), making it a valid flat correction.
The two most likely targets for the top of the C wave are found at $37,278 and $42,181. The first would give waves A:C a 1:1 ratio while the second would give them a 1:1.61 ratio.
A decrease below the July 20 low at $29,279 would invalidate this particular wave count.
For a more detailed look at the longer-term wave count, click here.