Hedera Hashgraph (HBAR) is trading inside a descending wedge above the 480 satoshi support area. Chiliz (CHZ) has broken out from a descending wedge. Helium (HNT) is trading above support at 32,000 satoshis but is still following a descending resistance line.
This article will cover the BTC pairs. For the article which covers the USD pairs, click here.
HBAR
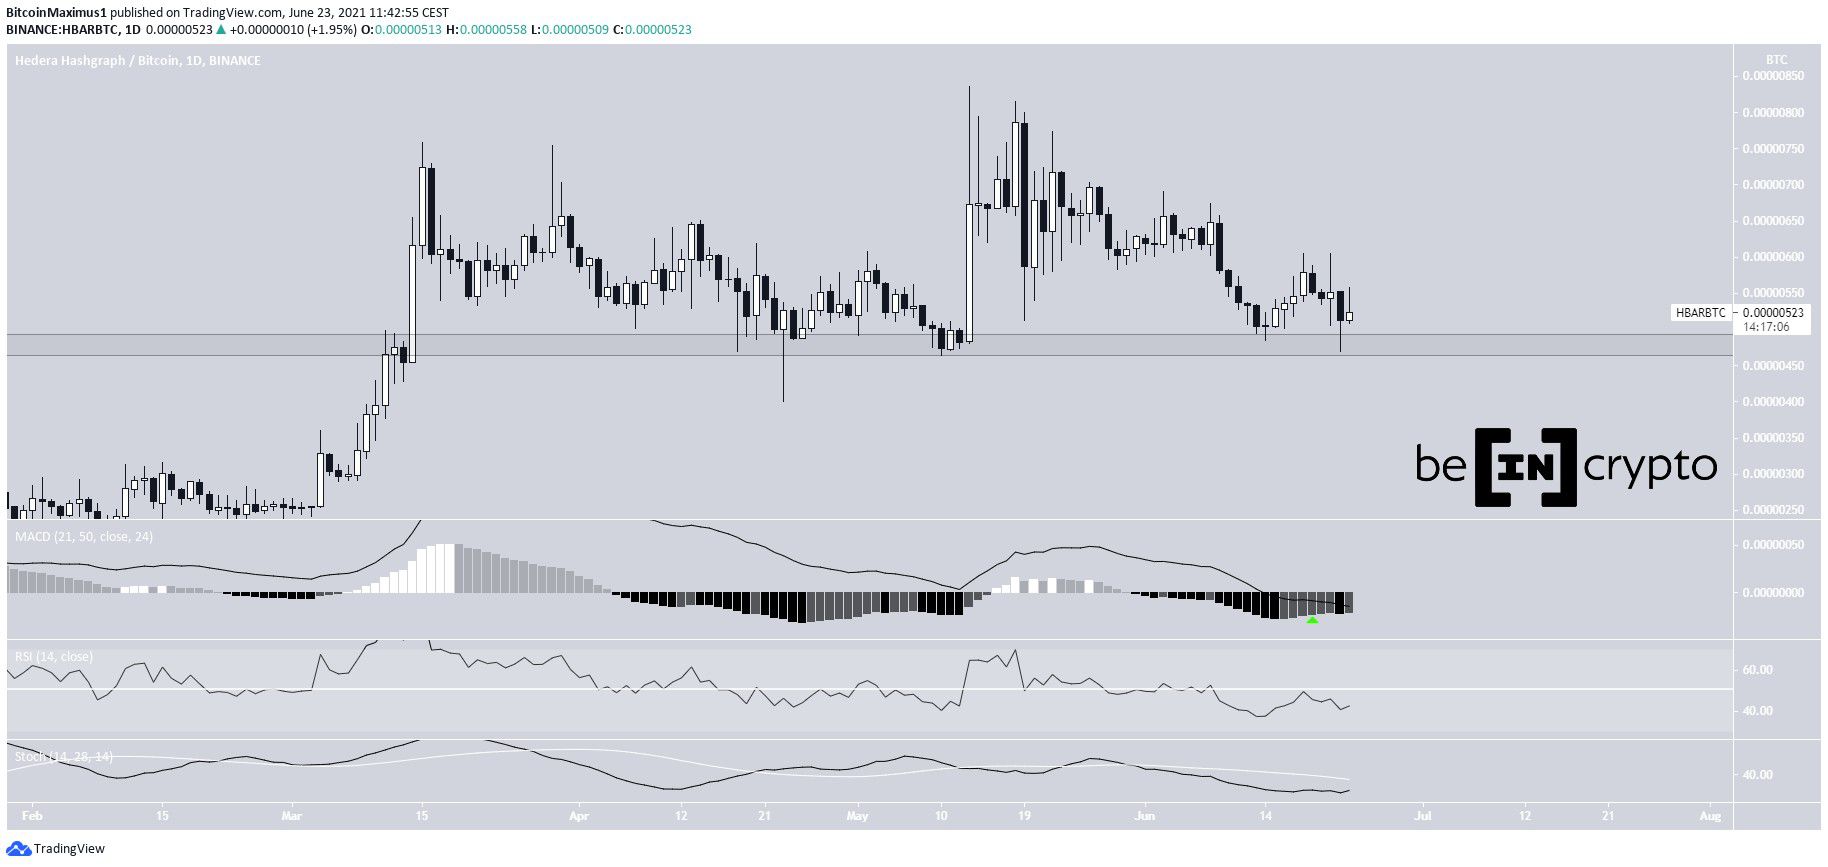
HBAR has been falling since reaching a high of 836 satoshis on May 13. On June 14 and 22, it bounced above the 480 satoshi horizontal support area. It has been trading above this level since the beginning of March.
Technical indicators are showing some bullish signs, but not enough to confirm the bullish reversal. While the MACD is moving upwards, the RSI is below 50 and the Stochastic oscillator has yet to make a bullish cross.
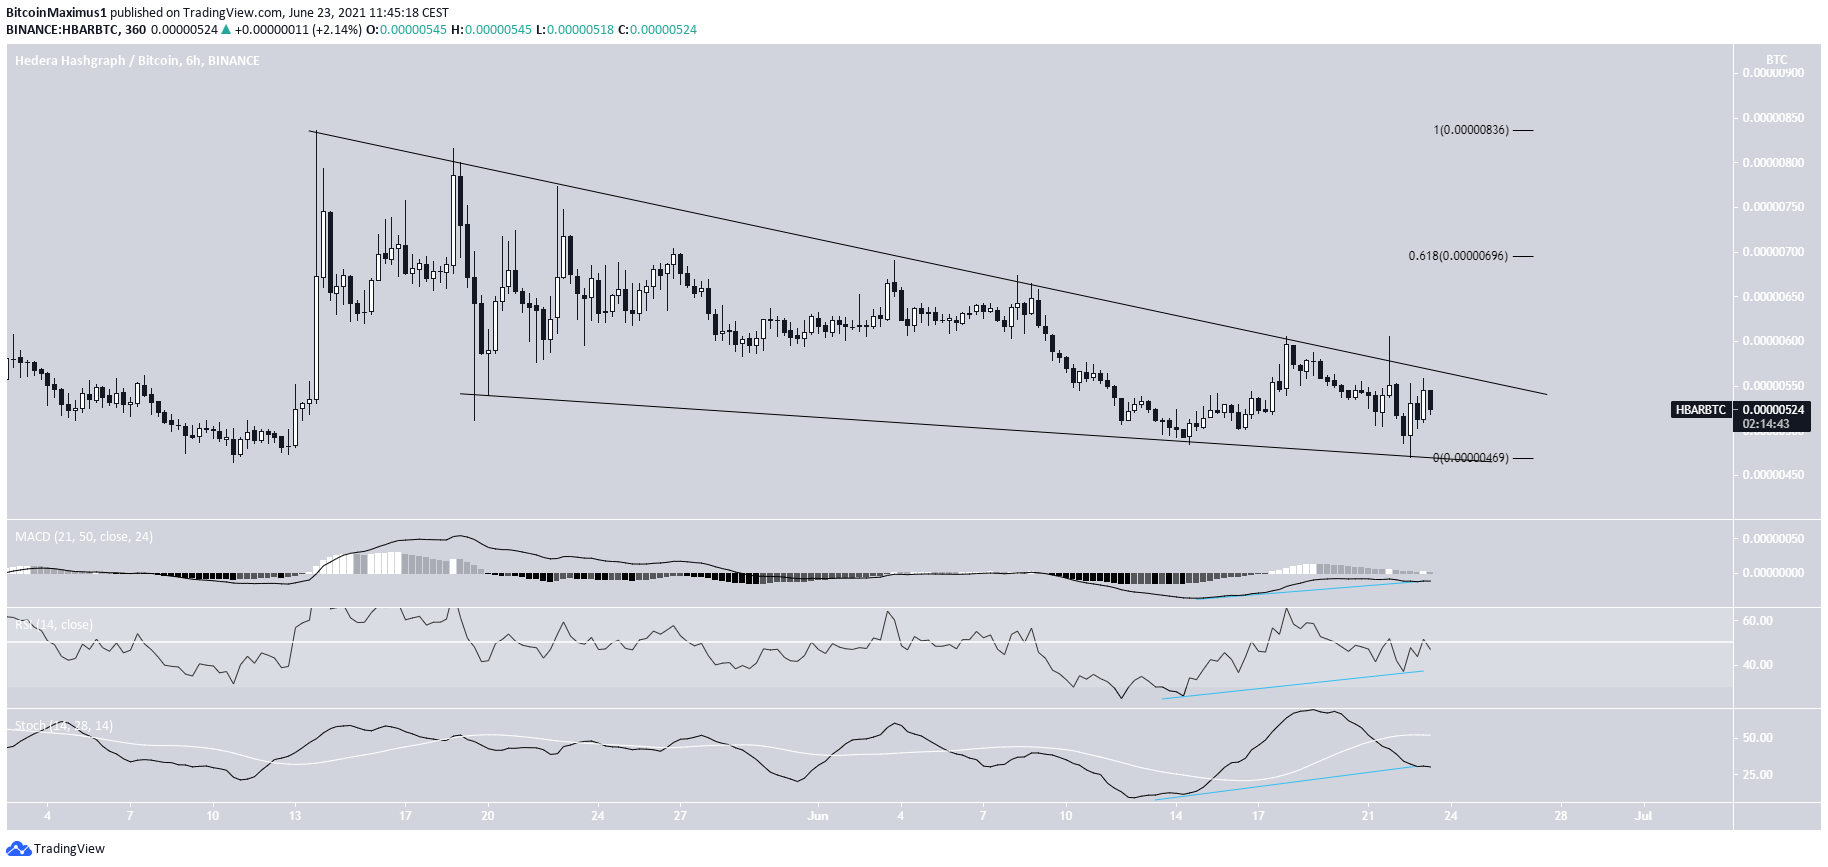
The shorter-term six-hour chart shows that the token is trading inside a descending wedge, which is considered a bullish reversal pattern.
In addition, short-term indicators are bullish. The MACD, RSI & Stochastic oscillator have all generated considerable bullish divergence. This is a sign of an impending breakout.
If so, the next resistance levels would be at 696 and 836 satoshis, respectively.
Highlights
- HBAR is trading above support at 480 satoshis.
- It is following a descending wedge
CHZ
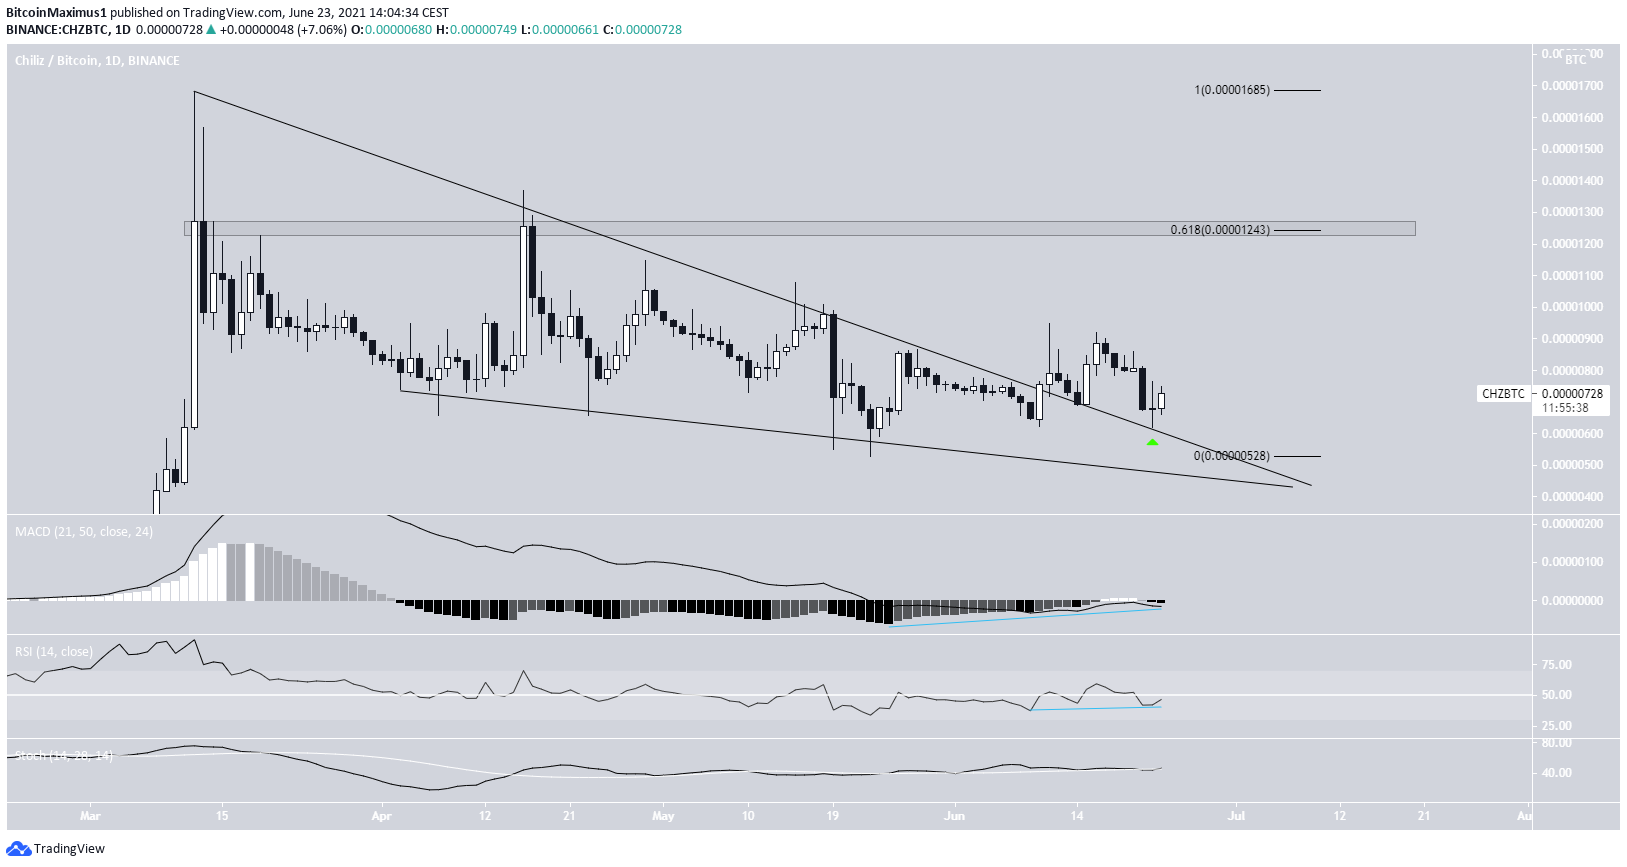
CHZ had been trading inside a descending wedge since reaching an all-time high on March 12. On May 23, it bounced at the support line of the wedge and managed to break out on June 11.
On June 23, it returned and validated the previous resistance line as support.
Technical indicators are relatively bullish. Both the MACD & RSI have generated bullish divergence and are moving upwards. Similarly, the Stochastic oscillator has made a bullish cross.
A MACD movement into positive territory and RSI movement above 50 would confirm that the trend is bullish.
If so, the next resistance would be at 1250 satoshis, the 0.618 Fib retracement resistance level.
Highlights
- CHZ has broken out from a descending wedge.
- There is resistance at 1250 satoshis.
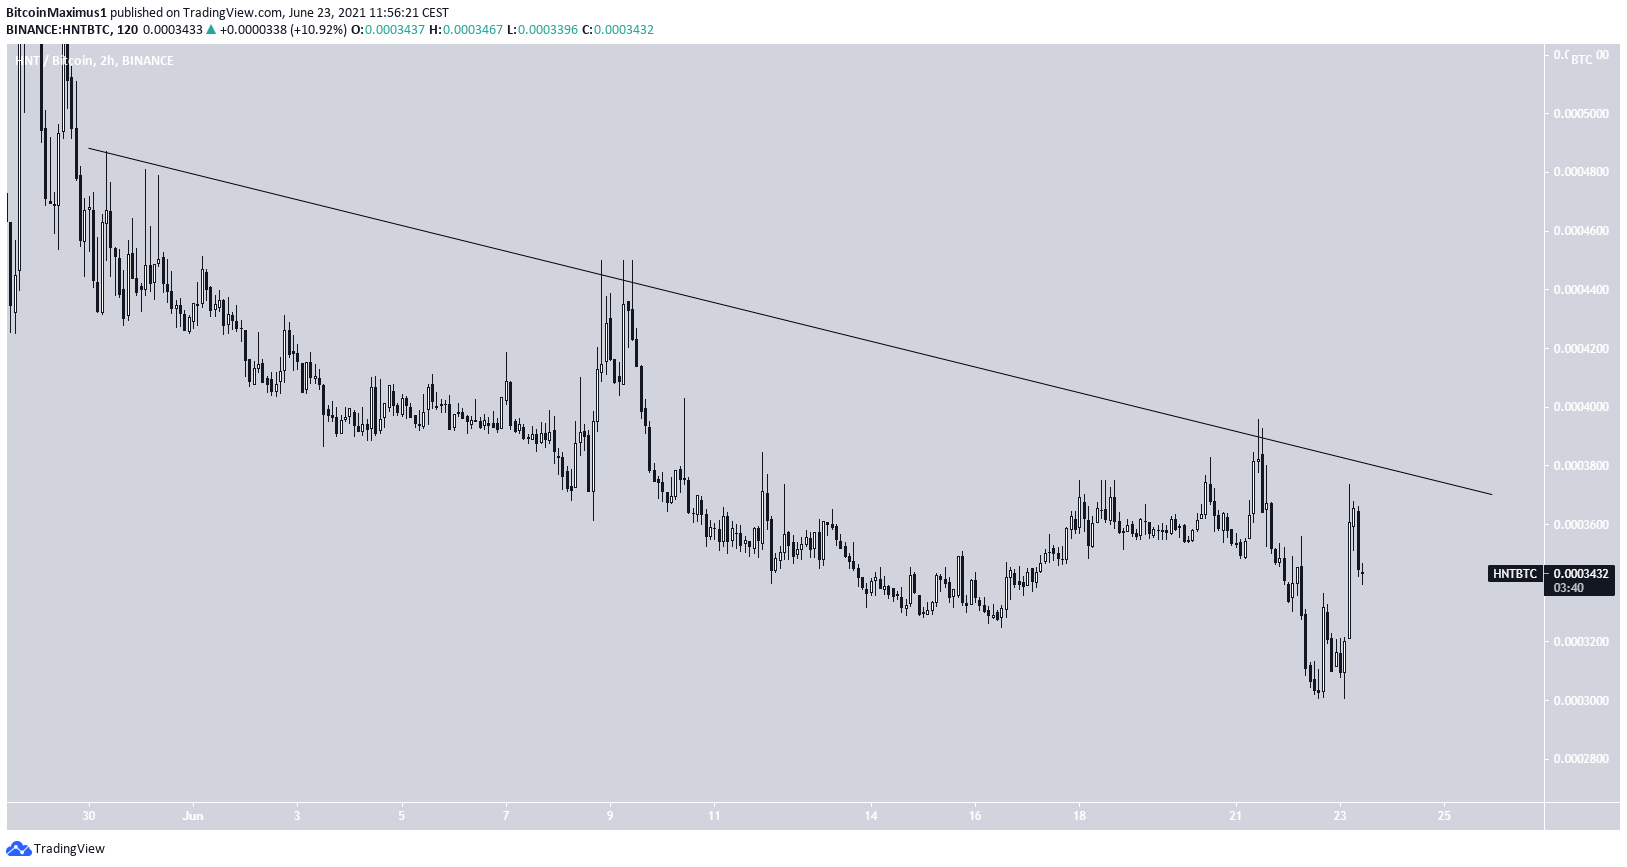
HNT
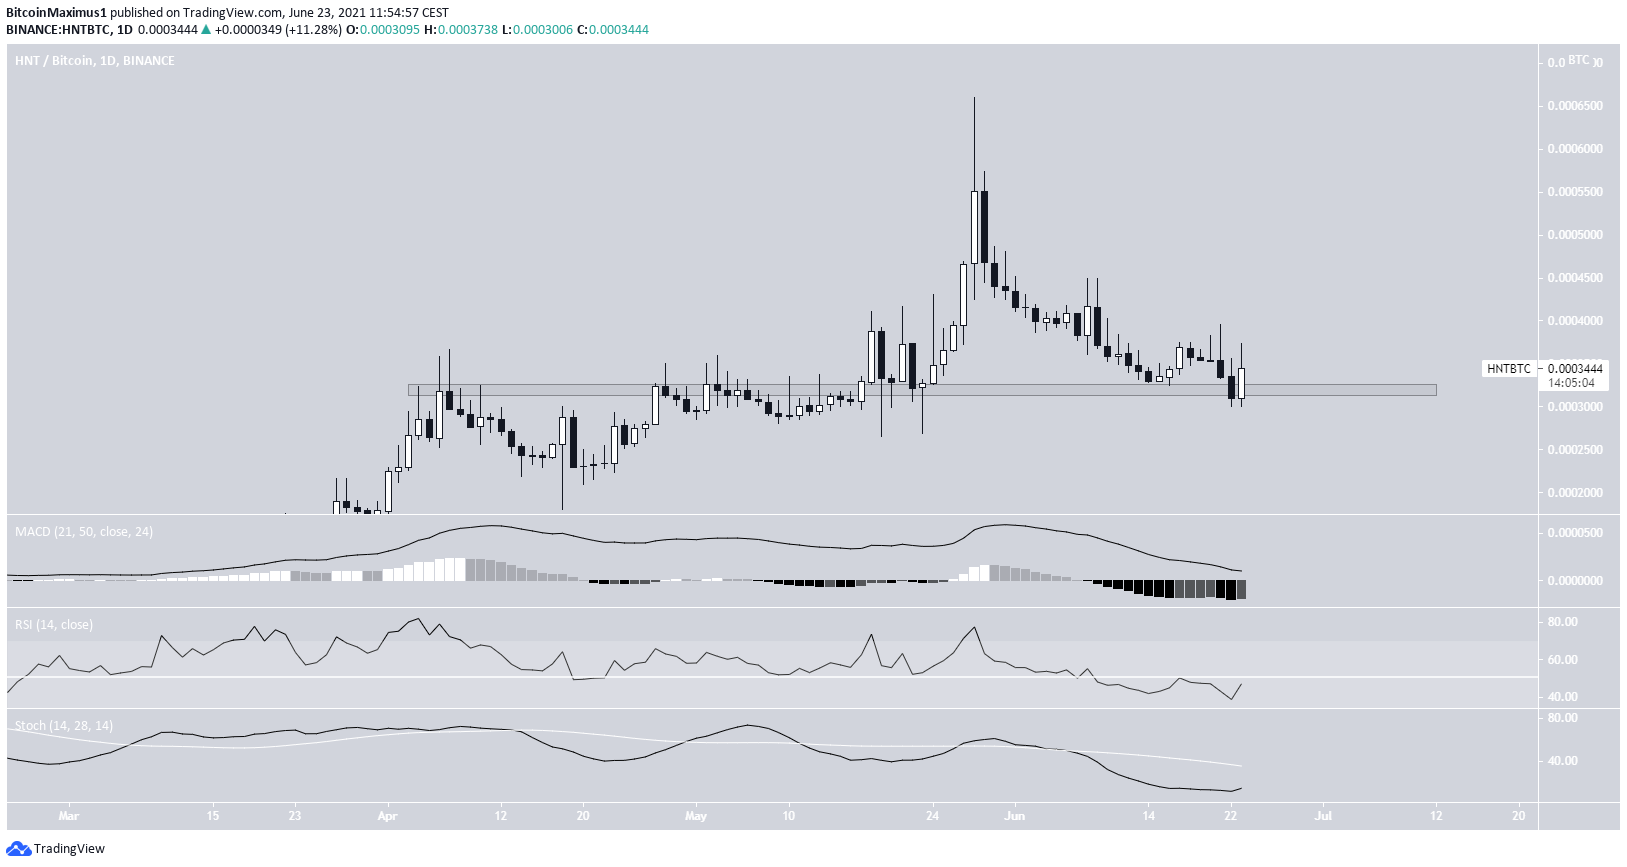
HNT has been falling since May 28, when it reached an all-time high price of 66,000 satoshis.
On June 22, it reached a low of 30,006 satoshis and bounced. The bounce validated the 32,000 satoshi area as support.
While indicators are showing some bullish signs, they have yet to confirm the reversal. While the MACD signal line is above 0, the RSI is still below 50 and the Stochastic oscillator has not made a bullish cross.
The shorter-term six-hour chart shows a descending resistance line in place since the beginning of June. Until HNT manages to break out from this line, the trend cannot be considered bullish.
Highlights
- HNT is trading above support at 32,000 satoshis.
- It is following a descending resistance line.
For BeInCrypto’s latest bitcoin (BTC) analysis, click here.