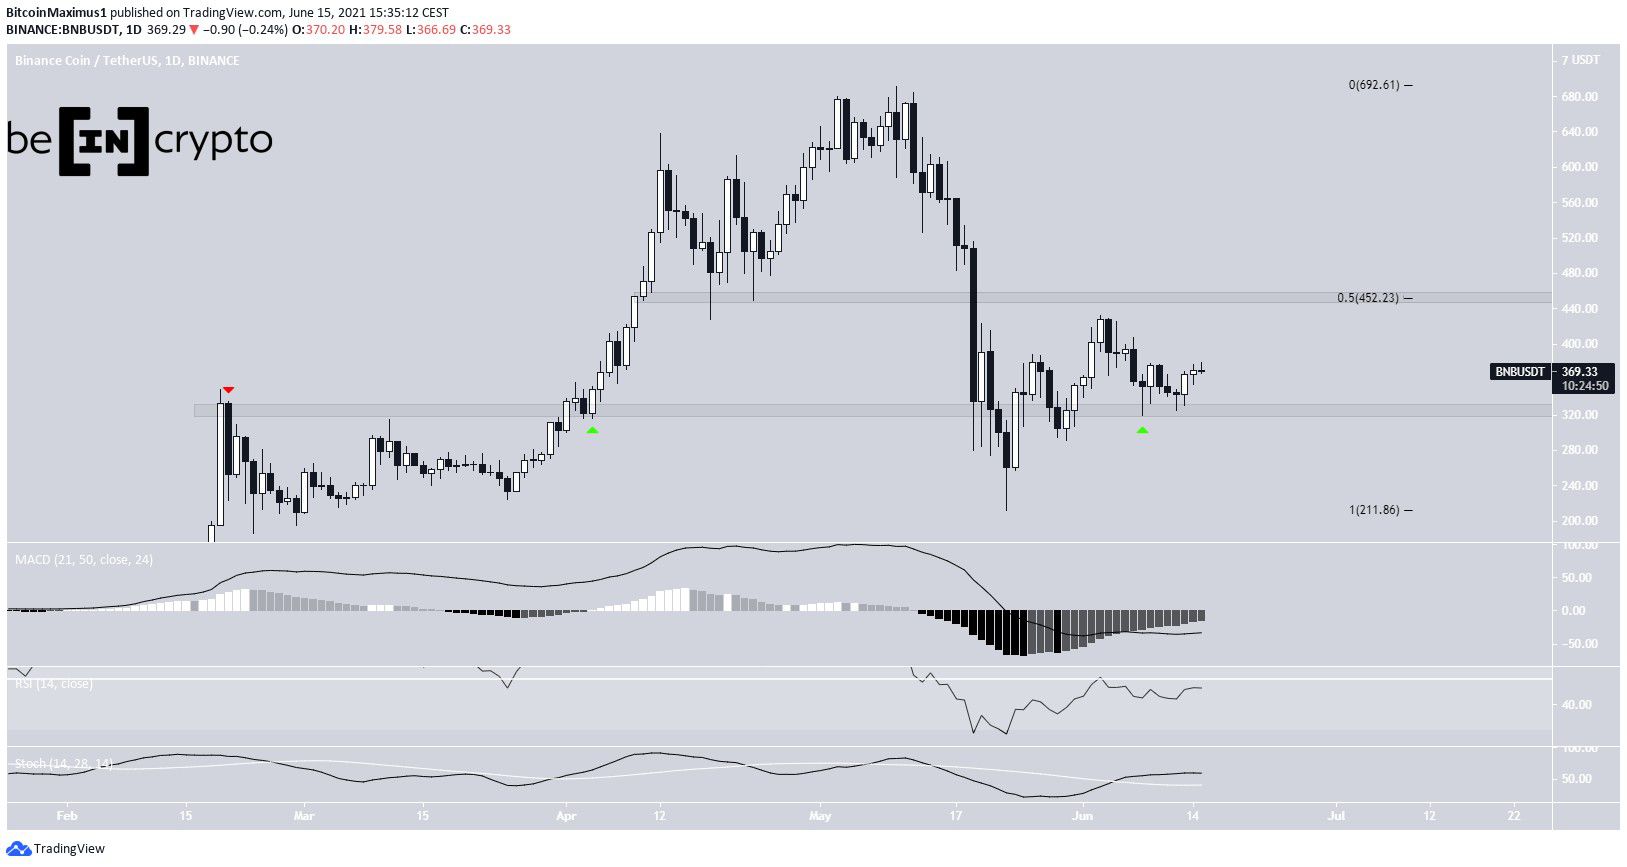
Binance Coin (BNB) has bounced at the $320 support area and broken out from a short-term descending resistance line afterwards.
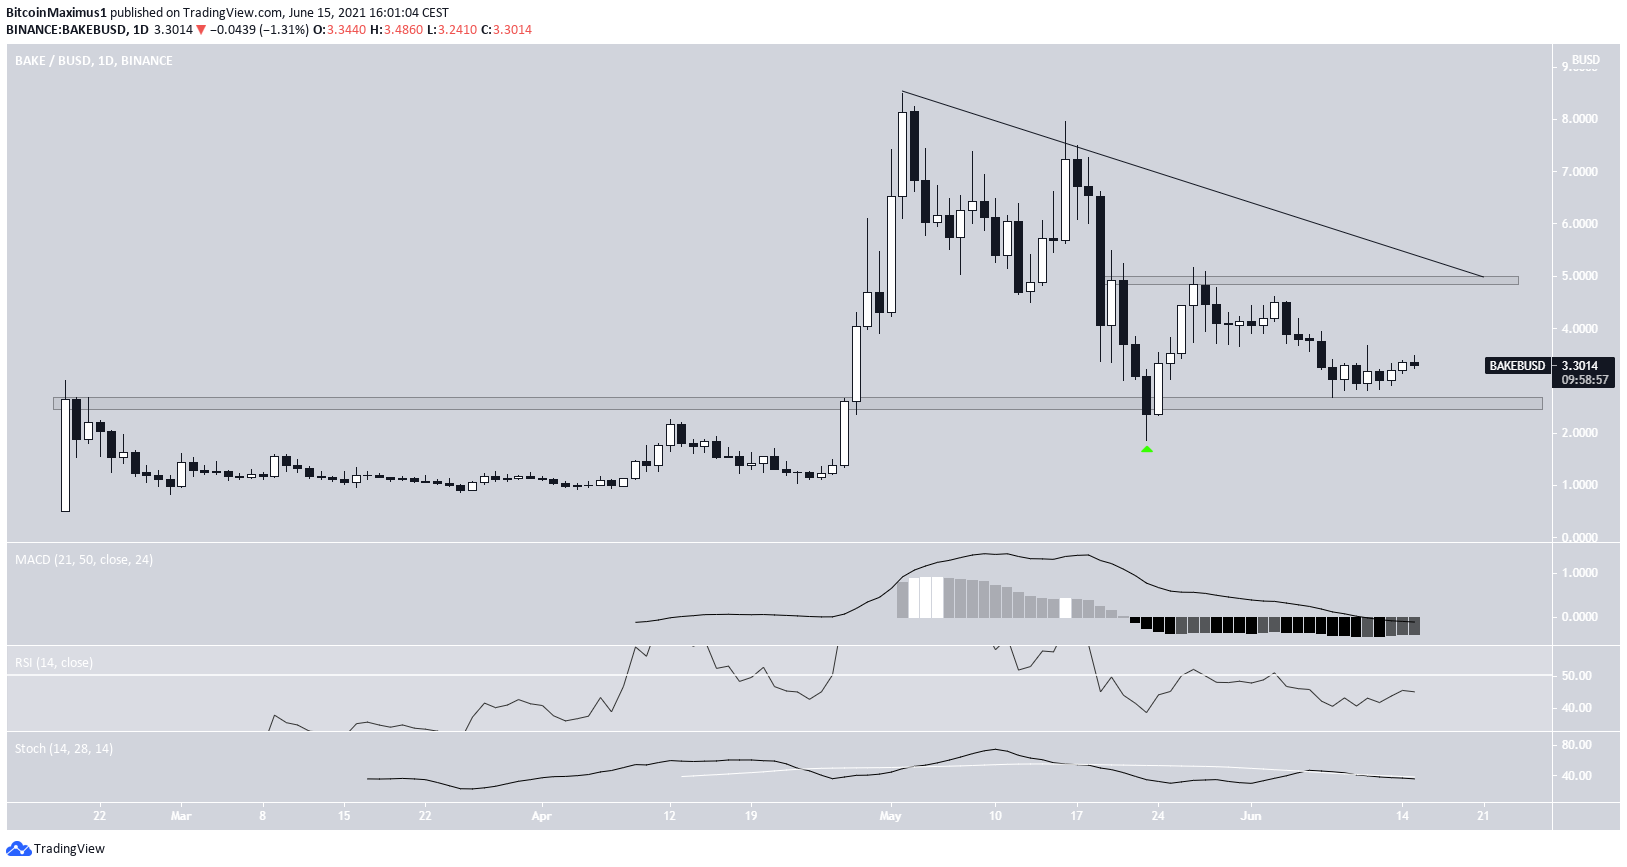
BakeryToken (BAKE) is following both a long- and a short-term descending resistance line.
Bella Protocol (BEL) has bounced at the $1.35 area. It is still following a descending resistance line.
BNB
BNB has been falling since reaching an all-time high of $691.77 on May 10. The drop culminated with a low of $211.70, reached on May 23. The token has been moving upwards since.
During the increase, it reclaimed the $320 area, validating it as support and creating a higher low in the process.
Technical indicators are providing some bullish signs, such as the bullish cross in the Stochastic oscillator. However, they have yet to confirm the bullish reversal, since the RSI is below 50 and the MACD is negative.
The closest resistance is at $450, the 0.5 Fib retracement level when measuring the entire drop.
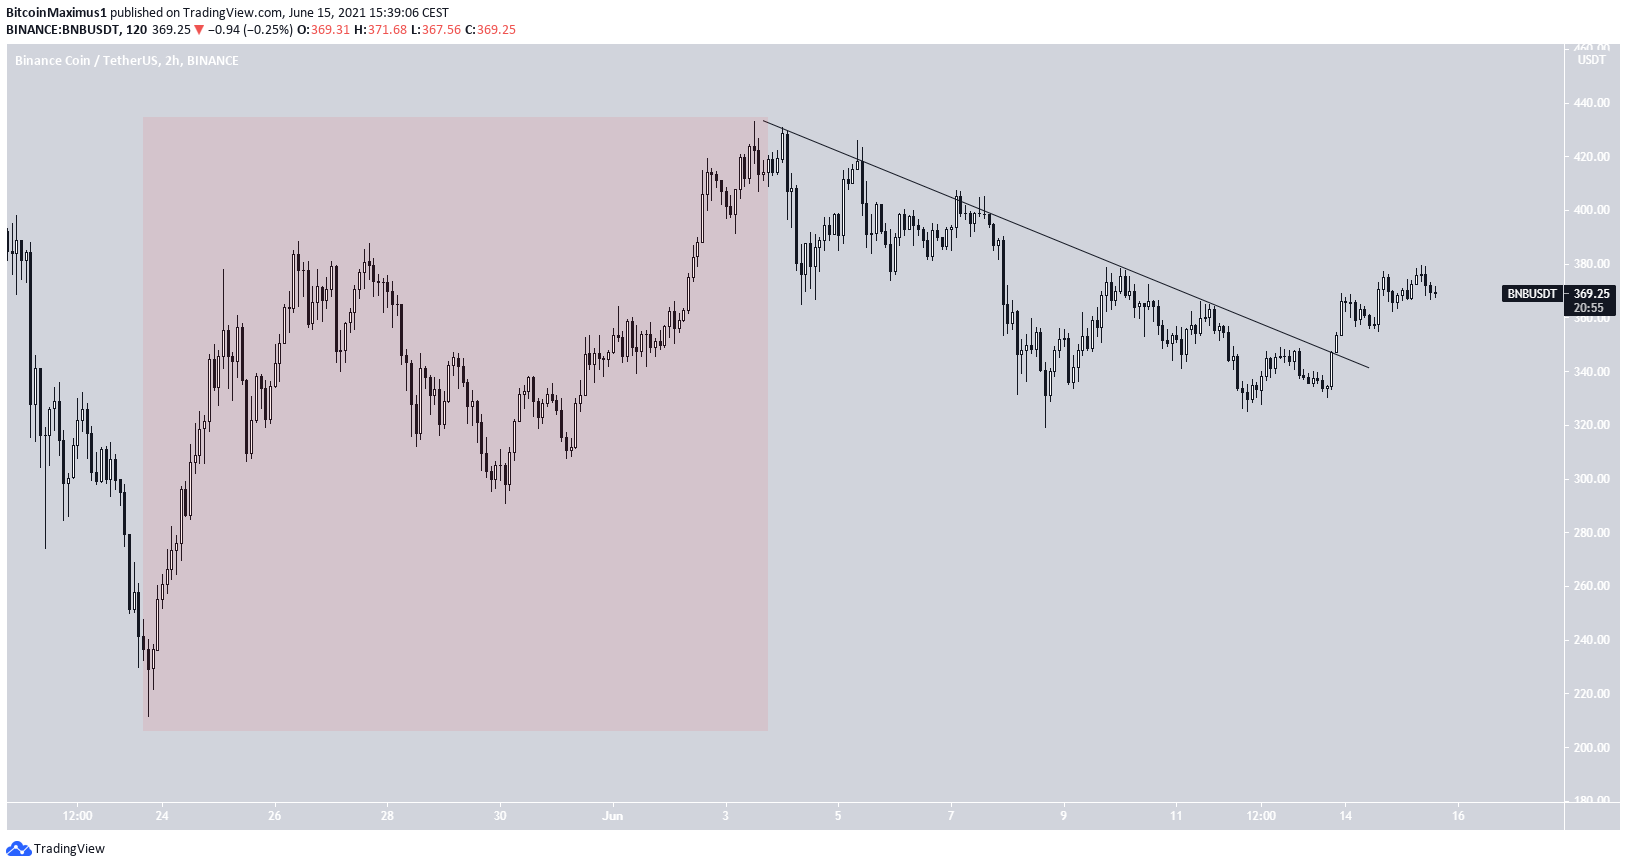
The shorter-term chart shows that BNB has broken out from a descending resistance line. This is a bullish development that could lead to an upward movement towards the previously outlined resistance area.
However, the bounce resulting from the May 23 low looks like a three wave structure (highlighted in red) instead of a five wave one. Therefore, it is unlikely that it is the beginning of a new bullish impulse.
As a result, while a short-term increase could occur, it is likely that the long-term trend is still bearish.
Highlights
- There is support and resistance at $320 and $450.
- BNB has broken out from a short-term descending resistance line.
BAKE
BAKE has been increasing since bouncing on May 23. At the time, it had just reached a low of $1.86. The bounce took it to a high of $5.16 before another sharp fall.
On June 8, the token created a higher low above the $2.56 area, validating it as support in the process.
Technical indicators are neutral/bearish. While the MACD is showing some bullish reversal signs, both the RSI & Stochastic oscillator are bearish.
Furthermore, BAKE is still following a descending resistance line, which coincides with the $4.90 resistance area. Therefore, the trend cannot yet be considered bullish.
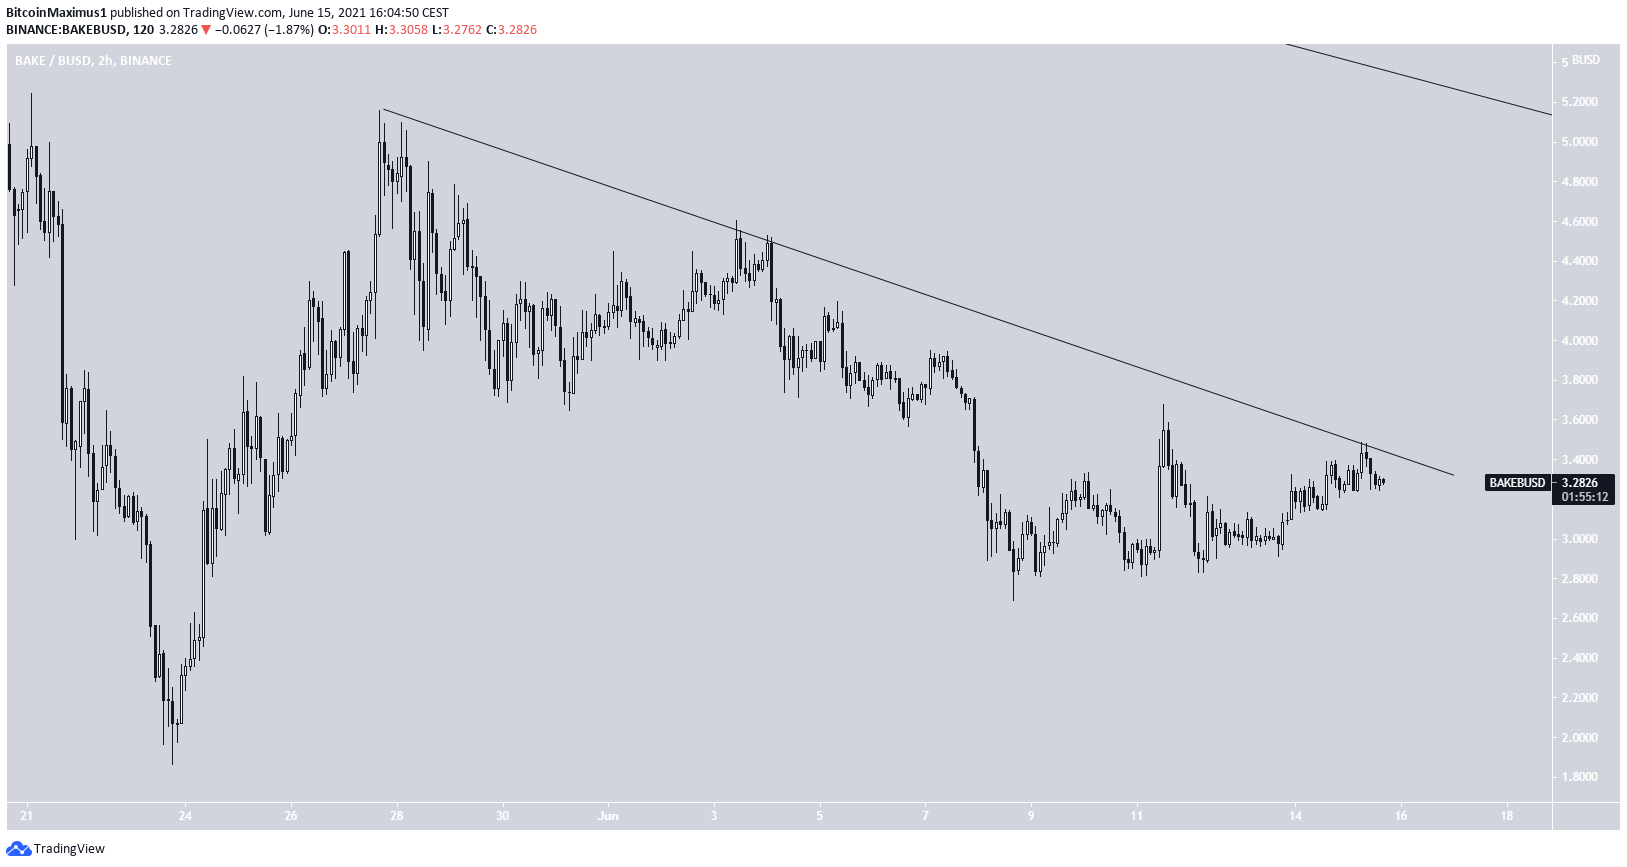
The shorter-term two-hour chart shows another descending resistance line in place. Until it breaks out, the short-term trend is also considered bearish.
A breakout would likely take BAKE towards the previously outlined $4.90 resistance area.
Highlights
- BAKE has bounced at the $1.86 support area.
- It is following a long- and short-term descending resistance line.
BEL
BEL has been decreasing alongside a descending resistance line since reaching an all-time high price of $5.84 on April 7.
The decrease culminated with a low of $1, which was reached on May 23. BEL has been increasing since, and created a higher low on June 8.
Technical indicators are providing bullish signs. The MACD has been increasing for two weeks, nearly crossing into positive territory. The Stochastic oscillator has made a bullish cross. While the RSI is still below 50, it is close to breaking out.
Therefore, a movement towards the descending resistance line is likely.
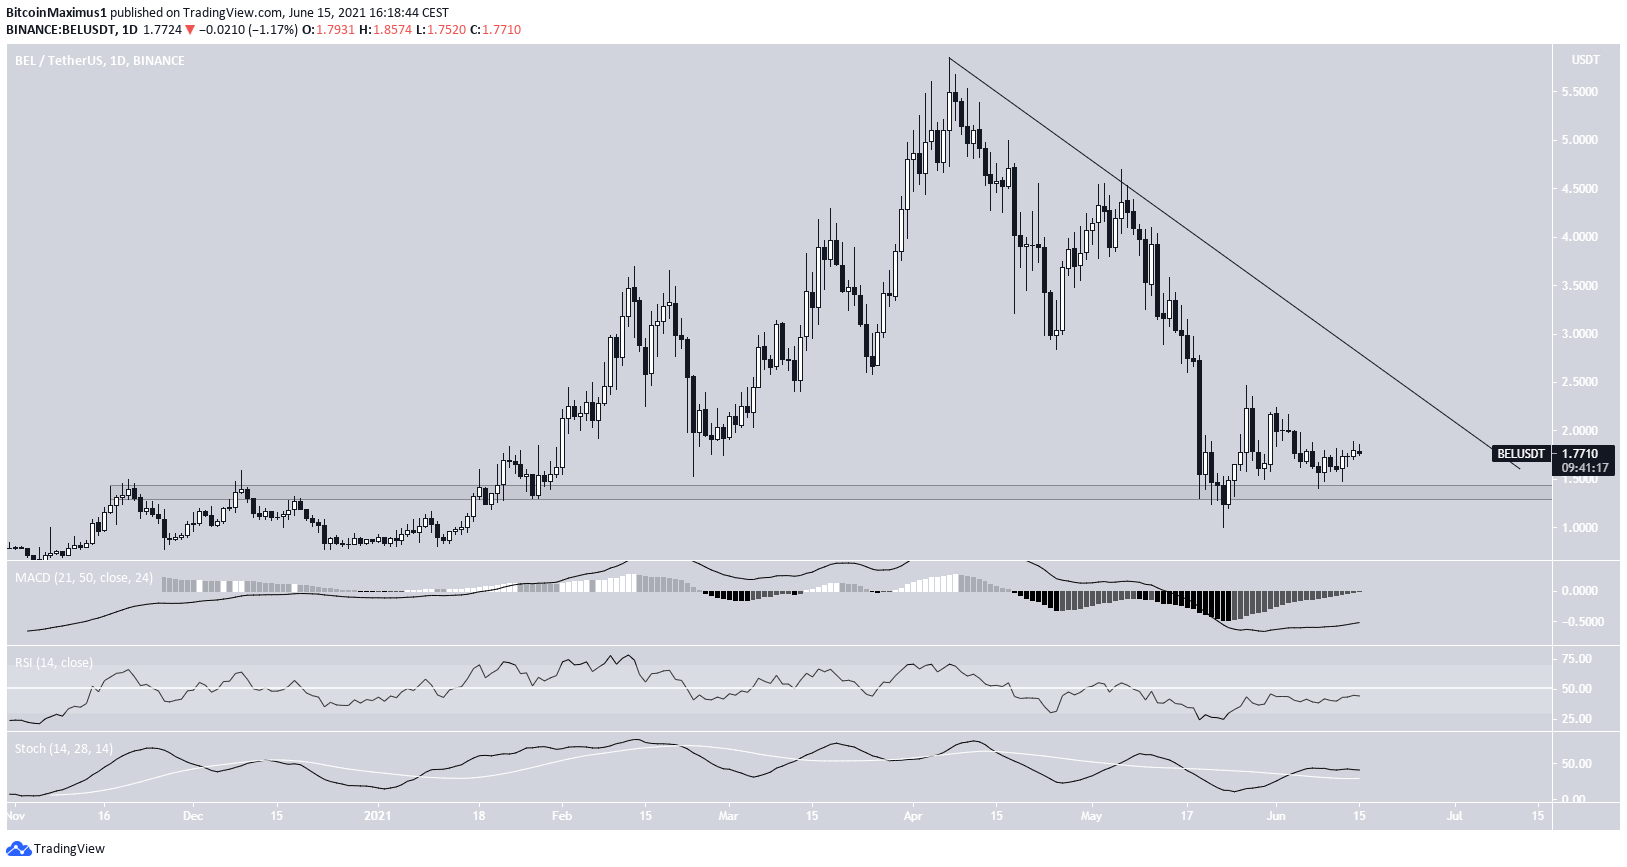
Highlights
- BEL has bounced at the long-term $1.35 support area.
- It is following a descending resistance line.
For BeInCrypto’s latest bitcoin (BTC) analysis, click here.