XRP token runs on a digital payment platform called RippleNet. RippleNet uses a top distributed ledger database which is called XRP ledger. In simpler words, XRP is a competition to existing payment platforms like SWIFT. XRP can either be stored on an exchange as well as cold and hot wallets. Technical Analysis of XRP is as follows:
Past Performance
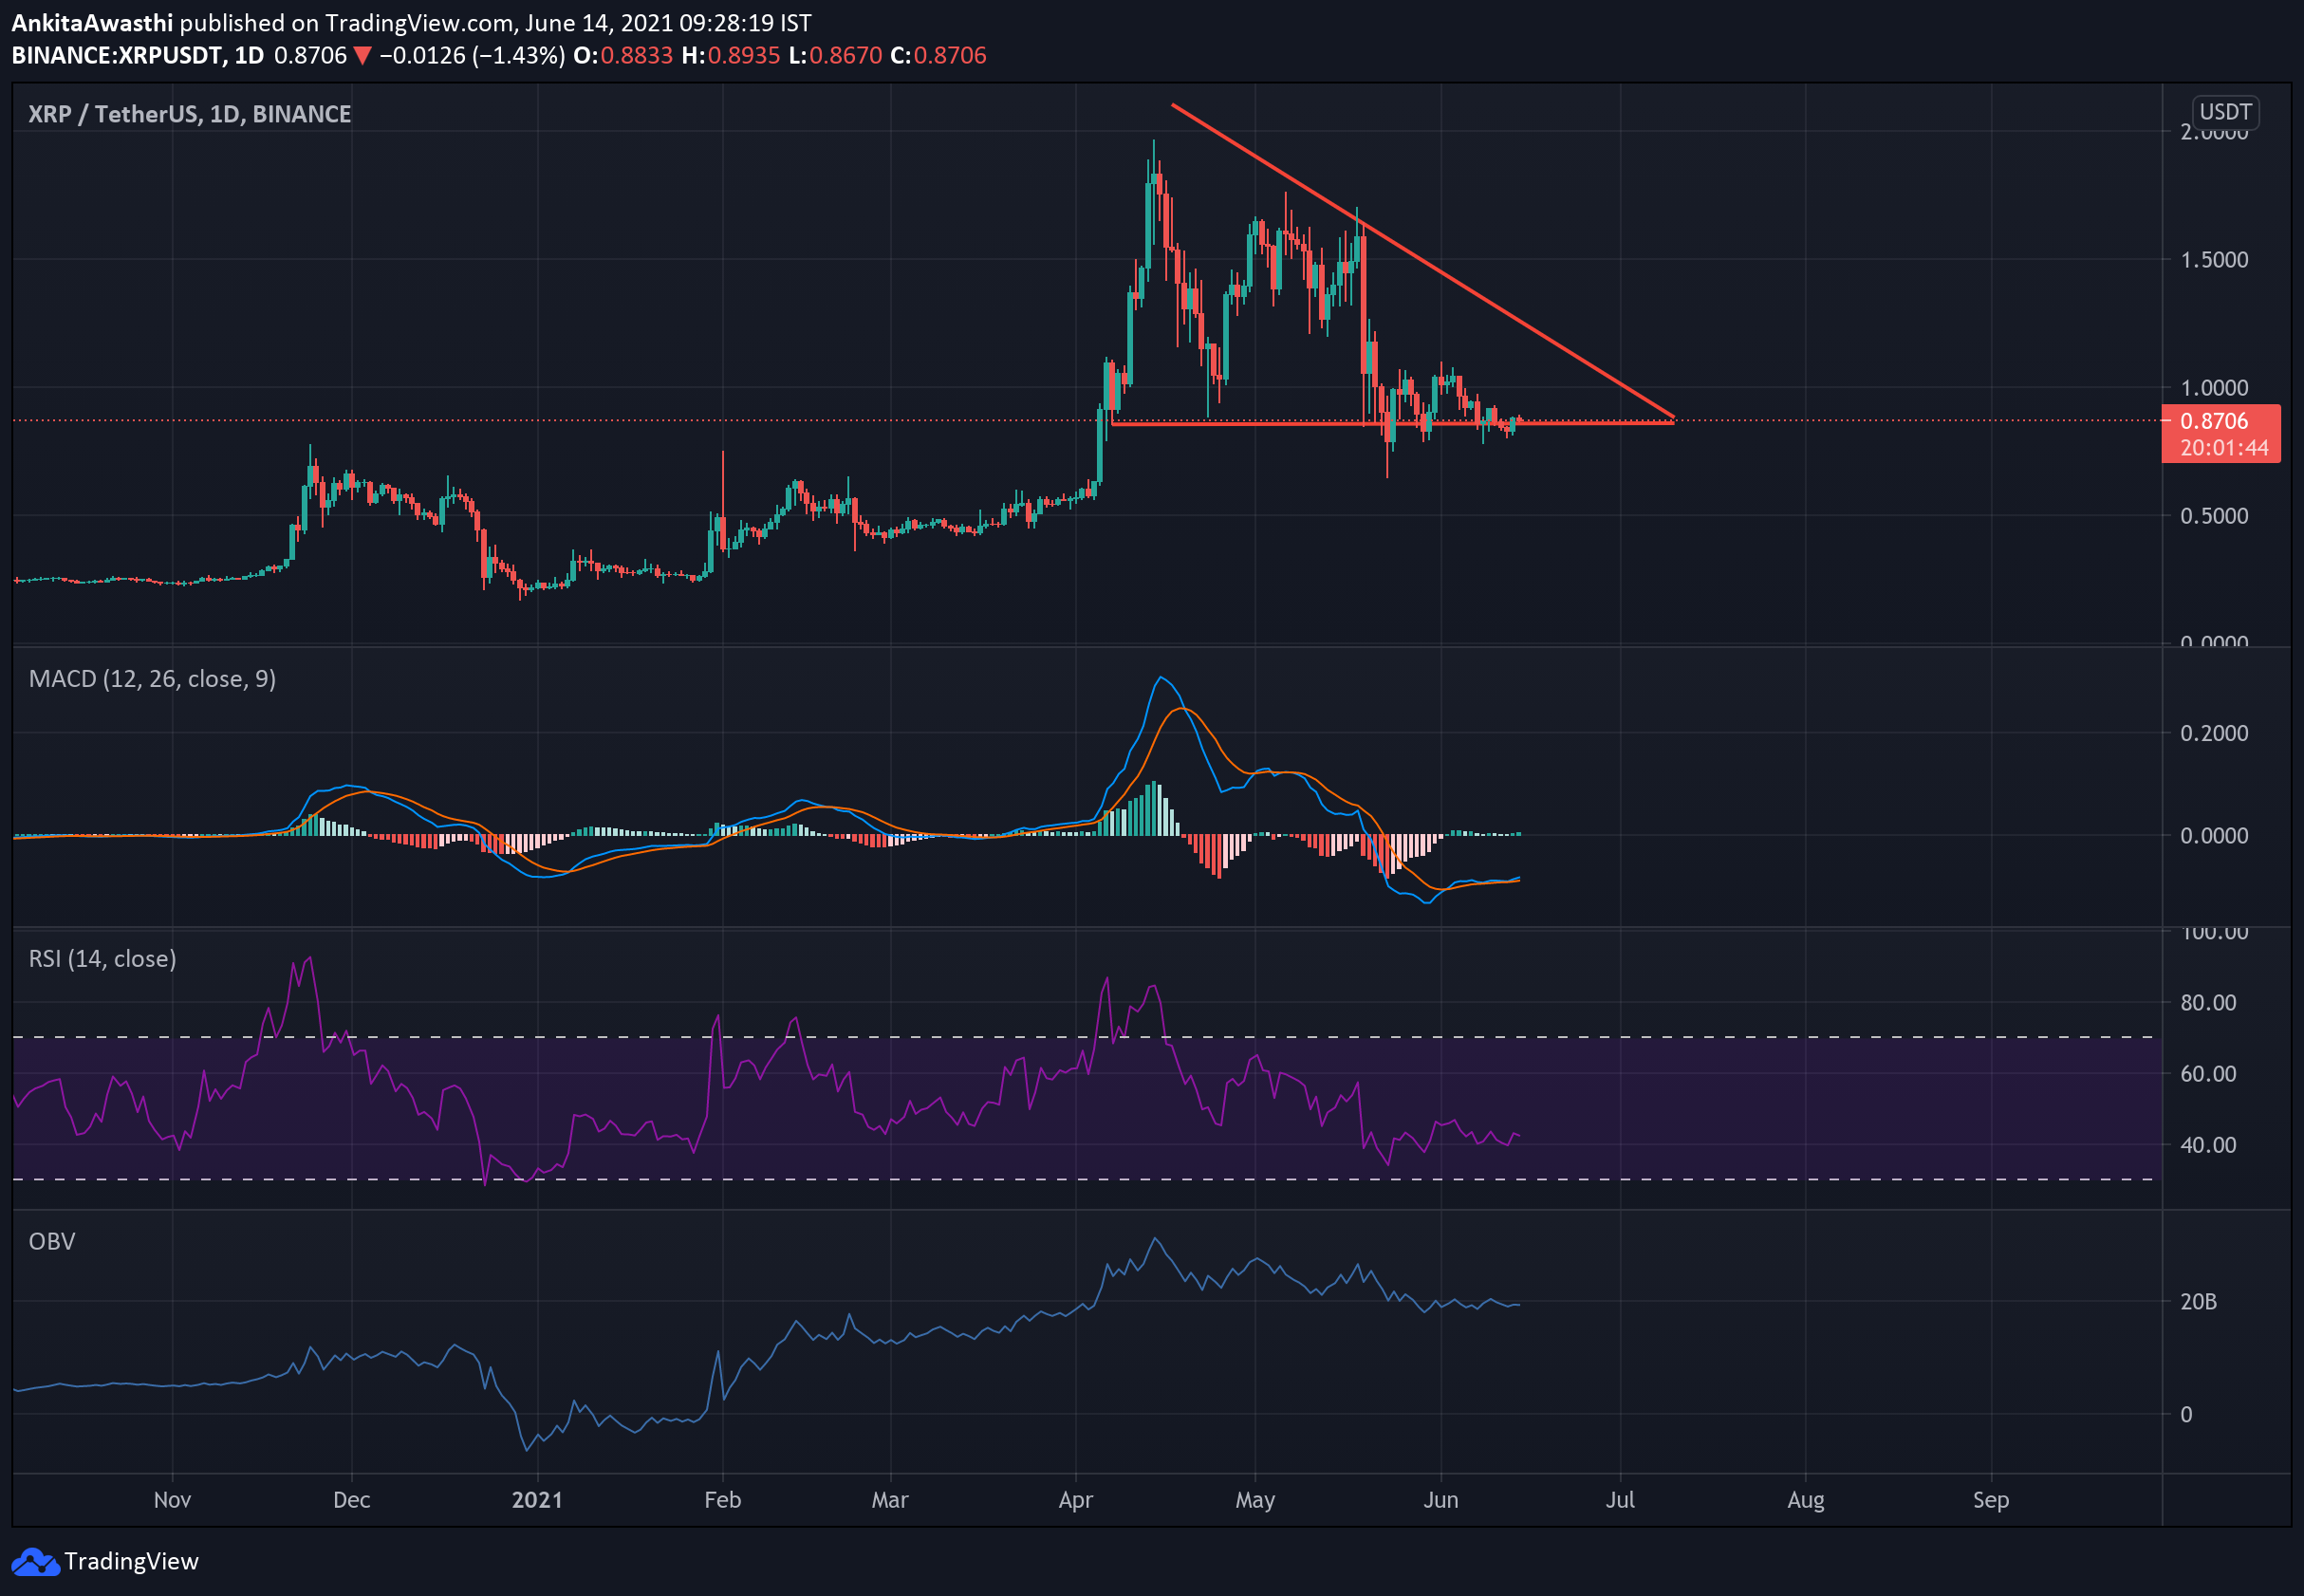
On June 7, 2021, XRP opened at $0.95. On June 13, 2021, XRP closed at $0.82. Thus, in the past week, the price has decreased by approximately 13%. In the last 24 hours, XRP has traded between $0.81-$0.89.
https://www.tradingview.com/x/koBXklFo/
Day Ahead And Tomorrow
Currently, XRP is trading at $0.87. The price has increased from the day’s opening price of $0.82. Thus, the market seems bullish.
The MACD and signal lines are negative. However, a bullish crossover by the signal line over the MACD line has occurred. Thus, the overall market momentum can be seen turning bullish. Hence, the price may rise further.
Currently, the RSI indicator is at 42%. It faced rejection and is taking constant support at 39% and rose to this level. Thus, buying pressures are slowly mounting for XRP. We have to wait and watch if buying pressures become strong enough to bring about a bearish trend reversal.
On the daily chart, the OBV indicator is downward sloping. Thus, selling volumes are higher than buying volumes. High selling activity will exert downward pressure on the XRP price.
In short, when we look at all three oscillators, we can say that the price may continue to rise. However, we cannot rule out the possibility of a trend reversal. We have to wait and watch to see if an intermittent price rise is a corrective action or the beginning of a positive trend.
XRP Technical Analysis
Currently, the price is below the second Fibonacci pivot point of $1.06. If the bears remain strong till day end, then the price is likely to fall below the first, second, and third support levels of $0.86, $0.79, and $0.63, respectively.
The price is trading below the 23.6% FIB retracement level of $0.89. It may soon fall below the FIB retracement level of $0.86. Thereafter, we have to wait and watch if the price retests and breaks out of these levels. In that case, the price upswing is likely to continue tomorrow as well.
However, on the upside, if the resistance at level $0.90 is broken, it will highlight the next resistance at $1.06, which can be kept as the target for the long call.