Polkadot (DOT) smoothens the process of cross-chain transfer of any asset class or data. DOT not only makes currencies transferable but also makes different blockchains interoperable. This feature of interoperability increases the scalability and use-case. Moreover, DOT bridges the gap between parachains and parathreads and connects them with external blockchain. DOT technical analysis is as below.
Past Performance
On June 7, 2021, DOT opened at $24.20. On June 13, 2021, DOT closed at $19.99. Thus, in the past week, the DOT price has decreased by approximately 17%. In the last 24 hours, DOT has traded between $19.99-$22.40.
https://www.tradingview.com/x/8ODxMCiE/
Day Ahead And Tomorrow
Currently, DOT is trading at $21.83. The price has increased from the day’s opening price of $20.37. Thus, the market seems bullish.
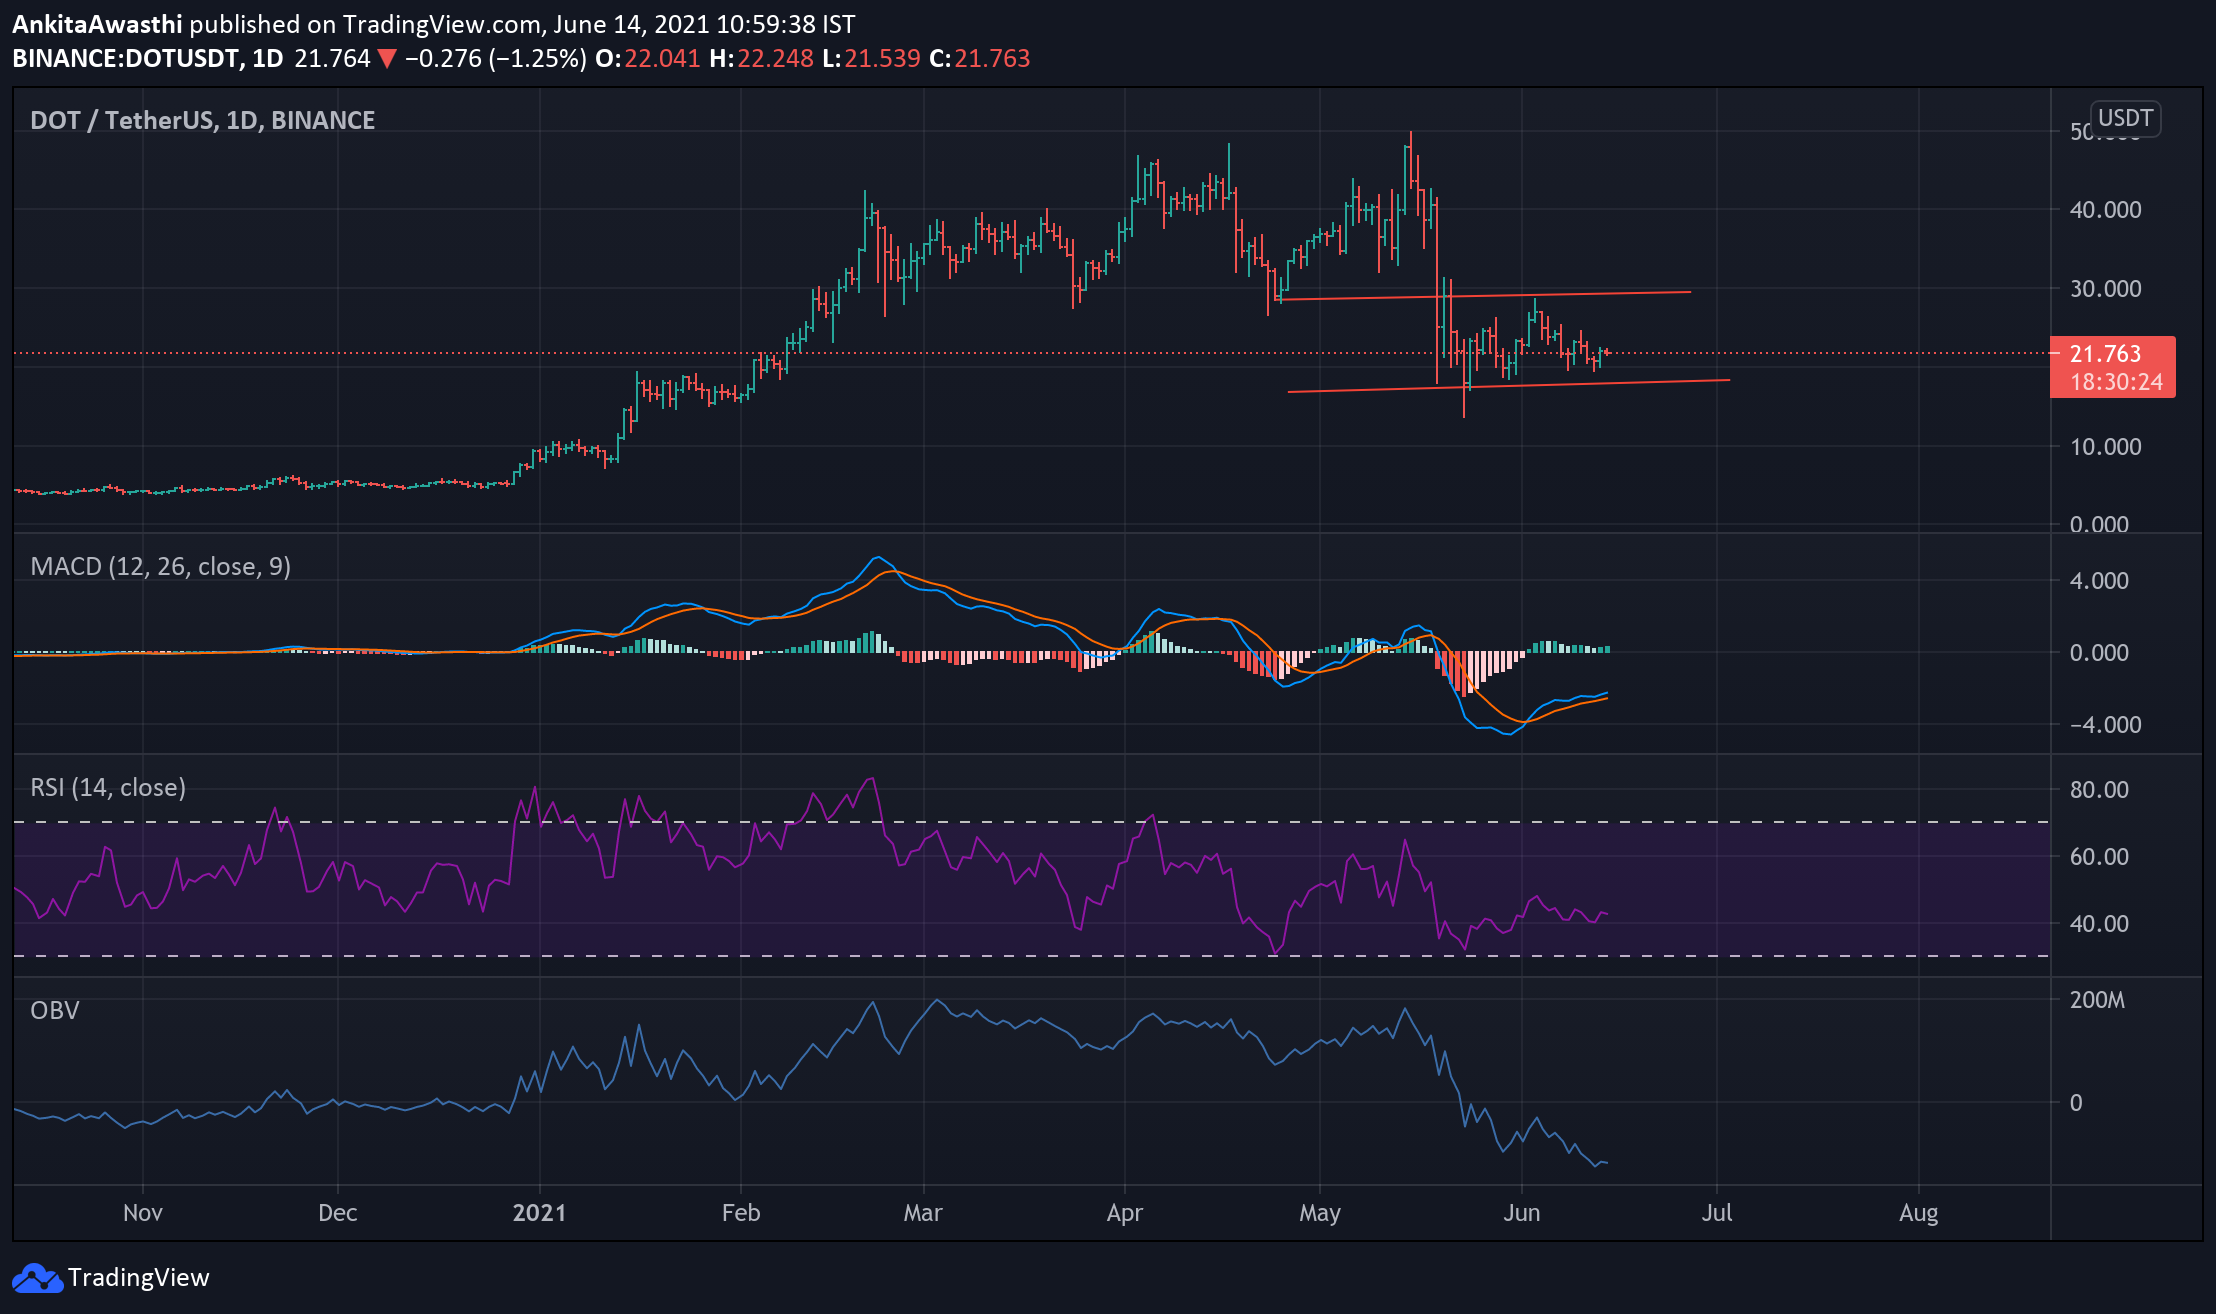
The MACD and signal lines are negative. However, a bullish crossover by the signal line over the MACD line has occurred. Thus, the overall market momentum is turning bullish. Hence, the price may rise further.
Currently, the RSI indicator is at 42.63%. It faced rejection at 38.45% and rose to this level. Thus, buying pressures are slowly mounting for DOT. We have to wait and watch if buying pressures become strong enough to bring about a bearish trend reversal.
On the daily chart, the OBV indicator is downward sloping. Thus, selling volumes are higher than buying volumes. High selling activity will exert downward pressure on the DOT price.
In short, when we look at all three oscillators, we can say that the price may continue to rise. However, we cannot rule out the possibility of a trend reversal. We have to wait and watch to see if an intermittent price rise is a corrective action or the beginning of a positive trend.
DOT Technical Analysis
Currently, the price is below the second Fibonacci pivot point of $23.44. If the bears remain strong till day end, then the price is likely to fall below the first, second, and third support levels of $21.24, $20.45, and $19.46, respectively.
The price is trading below the 38.2% FIB retracement level of $23.16. It may soon fall below the FIB retracement level of $21.34. Thereafter, we have to wait and watch if the price retests and breaks out of these levels. In that case, the price upswing is likely to continue tomorrow as well.
However, on the upside, if the resistance of level $21.34 is broken it will highlight the next resistance at $23.67, which can be kept as the target for the long call.