The cryptocurrency market is bleeding for the past few days and many major coins are suffering the wrath of the bear. Bitcoin Cash [BCH] has fallen massively after observing tremendous growth and moving to the fourth position on the CoinMarketCap.
At the time of press, BCH was valued at $132, with a market cap of $2 billion. The 24-hour trade volume of the coin was registered to be $260 million with a fall of 17.32% over seven days. The coin slipped by 5.23% in the past 24 hours and is still seen to fall by 1.03% over the past hour.
1-hour
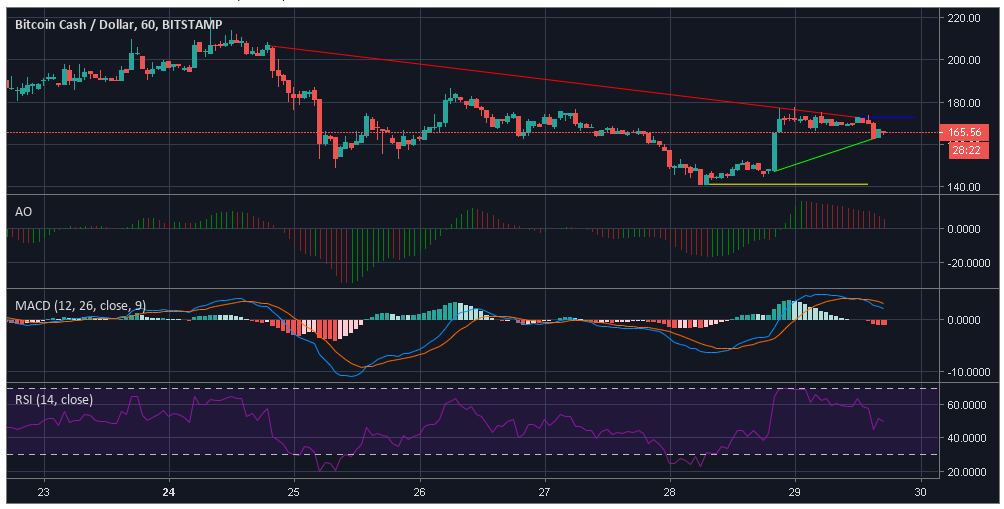
Source: Trading View
According to Trading View, BCH reported a downtrend from $156.47 to $131.47, which extended further to $129.27. The coin did not register a significant uptrend. The coin’s growth is restricted at $162.26 while support was provided at $127.46.
Awesome Oscillator indicates a bullish market losing momentum.
Chaikin Money Flow indicates a bullish market as the marker is above zero.
Bollinger Bands are at a converging point, indicating a decreased volatility in the market. The moving average line was above the candlesticks marking a bearish market.
1-day
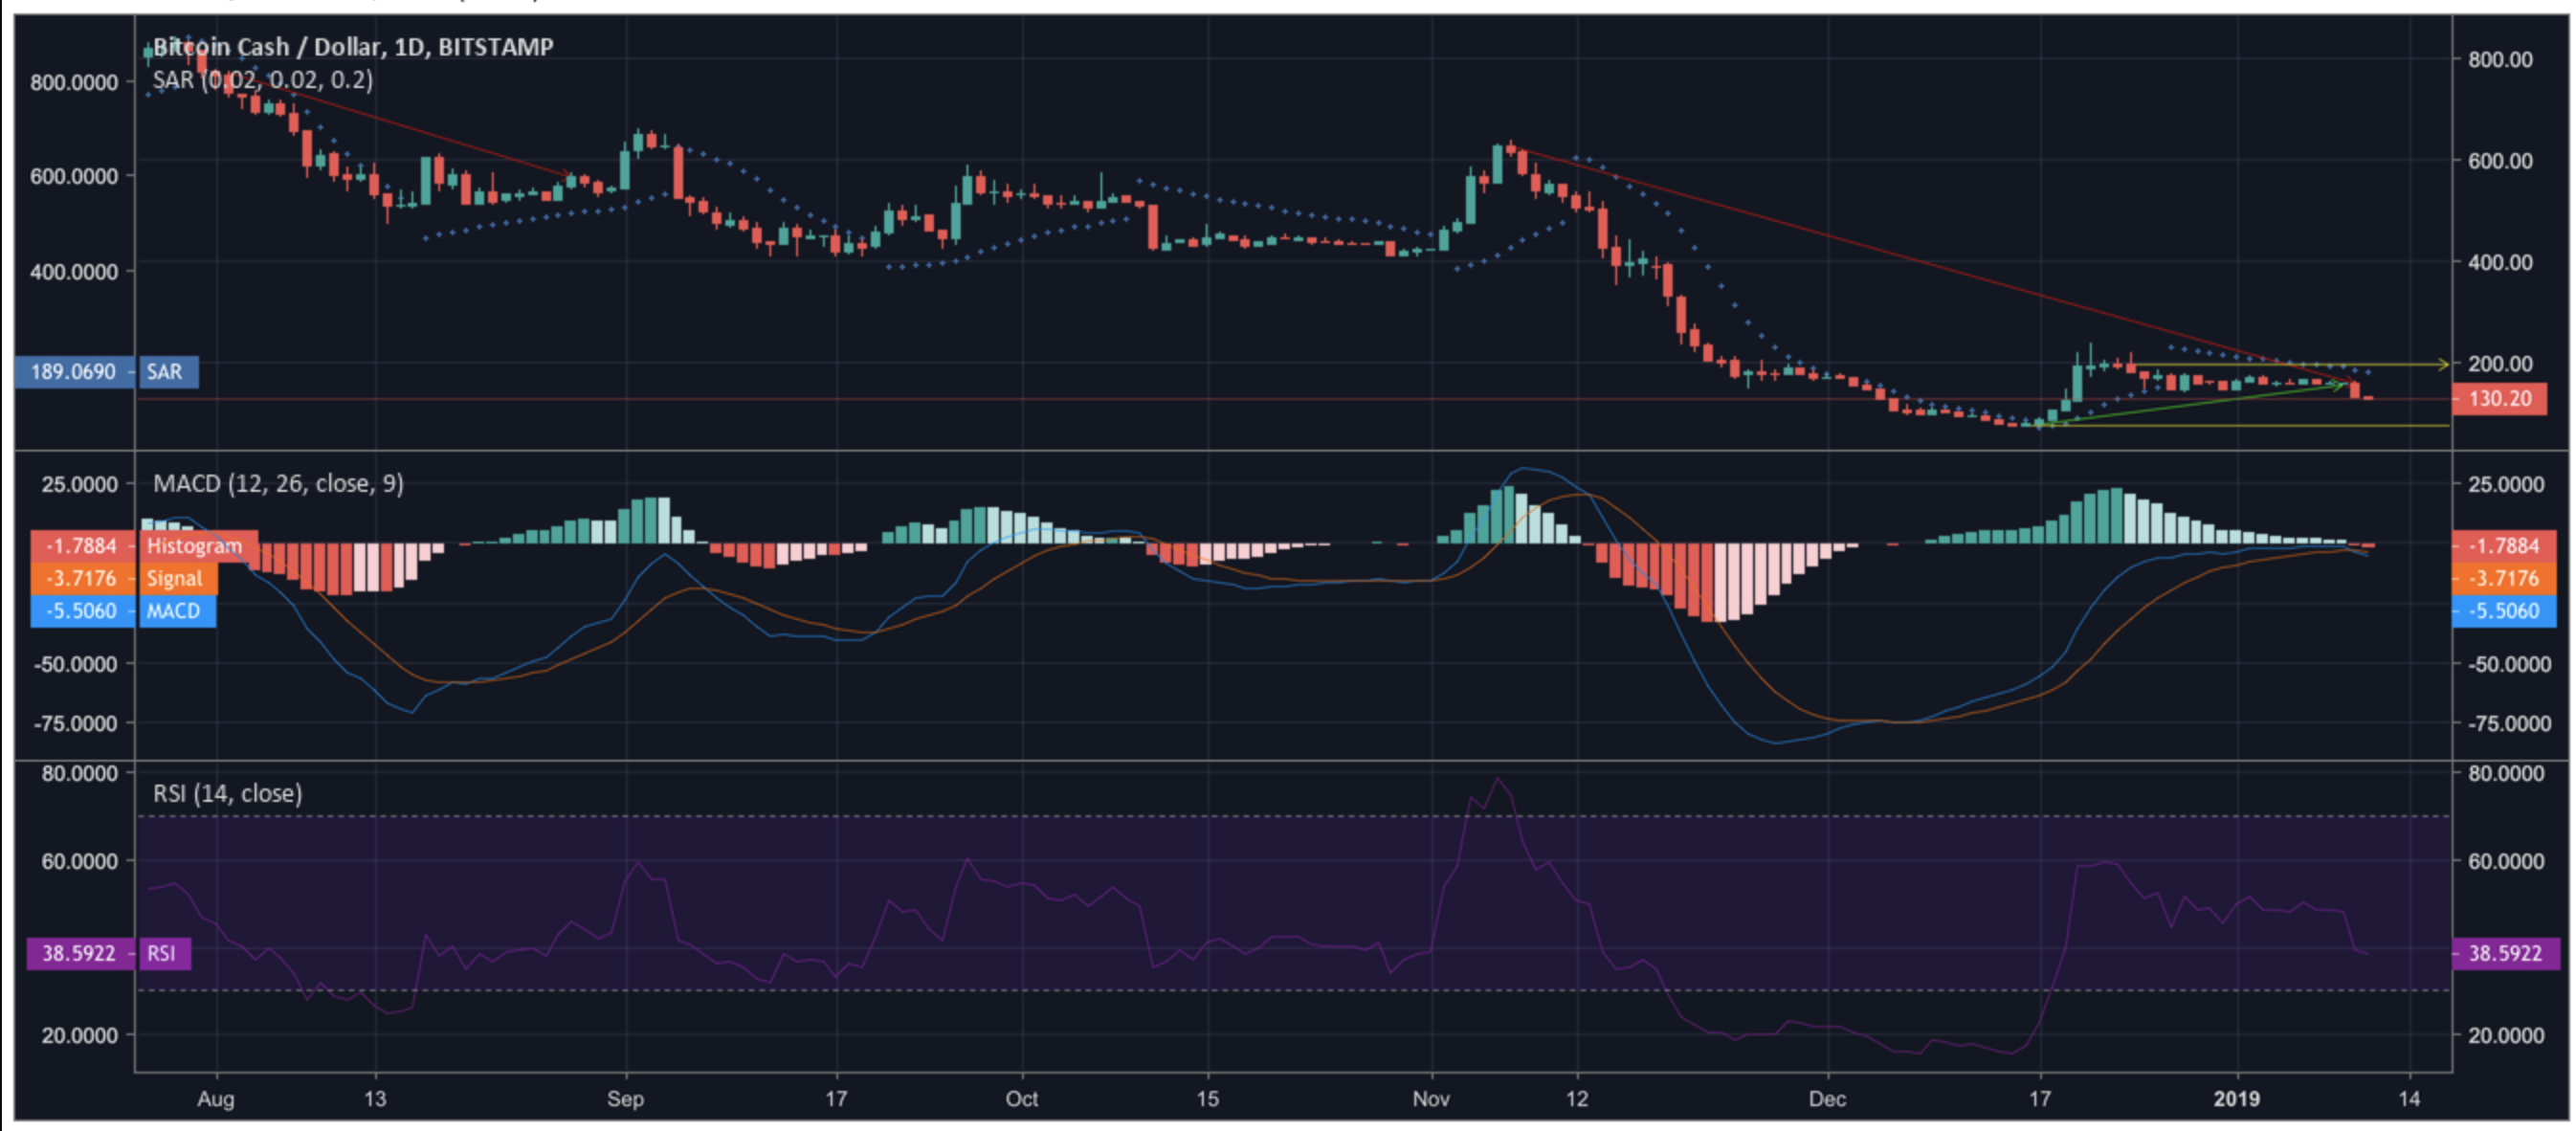
Source: Trading View
The one-day chart of Bitcoin Cash indicates an enormous fall from $772.74 to $566.10, which further extends from $627.54 to $155.80. The coin registered a significant uptrend from $156.10 to $178.40 in the one day chart. The coin met with resistance at $196.55 while the support goes as low as $76.19.
Parabolic SAR marks a bearish market with markers aligning above the candlesticks.
MACD line is under the signal line pointing towards a bearish market right after a recent crossover.
Relative Strength Index indicates that the buying and selling pressures are evening each other out.
Conclusion
As per the one-hour chart, Bollinger Bands, Parabolic SAR, and MACD indicate a bearish market. However, Awesome Oscillator and Chaikin Money Flow predict a bullish trend. Going by the majority, the market forecasted is a bearish one.