The cryptocurrency market has witnessed a sudden fall in the past 24 hours, wherein Bitcoin [BTC] has dropped below the $4000 mark. At press time, Litecoin [LTC] is trading at $33.26 with a market cap of $1.9 billion. The daily statistics of LTC is showing a loss of 4.9%, however, the cryptocurrency is still flashing green on the weekly chart with a 3% gain.
1-hour:
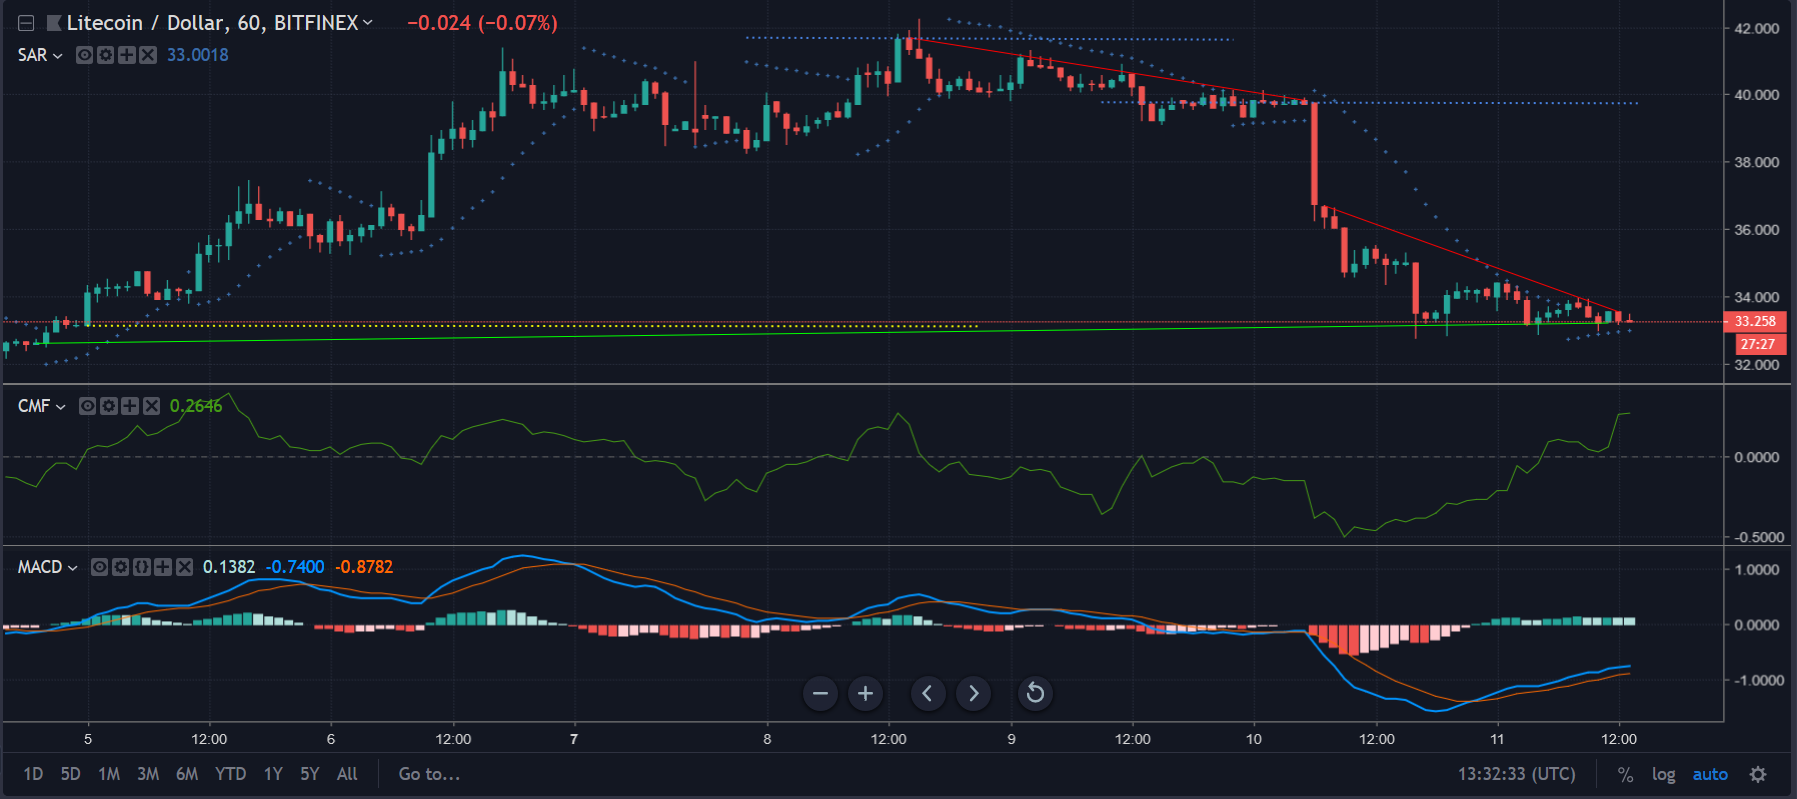
LTC 1 hour chart | Source: TradingView
The hourly chart of Litecoin shows a massive downtrend from $41.6 – $39.8 and $36.557 – $33.54. The sudden price fluctuation has created strong resistance points at $39.7 and $41.6. Also, in this timeframe, there is a slight uptrend ranging between $32.4 and $33.1 with a support point at $33.
The Parabolic SAR has shown an unforeseen fall a few hours back by pushing the candlesticks downwards. However, the indicator is currently forming the dots below the candlesticks depicting a slight recovery from the major fall.
Chaikin Money Flow has maintained its position above the zero line even when the price dropped and continues to be at a positive level. Thus indicating that there is an ample amount of incoming assets in the LTC market.
The MACD has also taken a bearish crossover a few hours back. It can be noticed that the moving average line has now taken a bullish crossover and it is currently moving upwards along with the signal line.
24 hours:
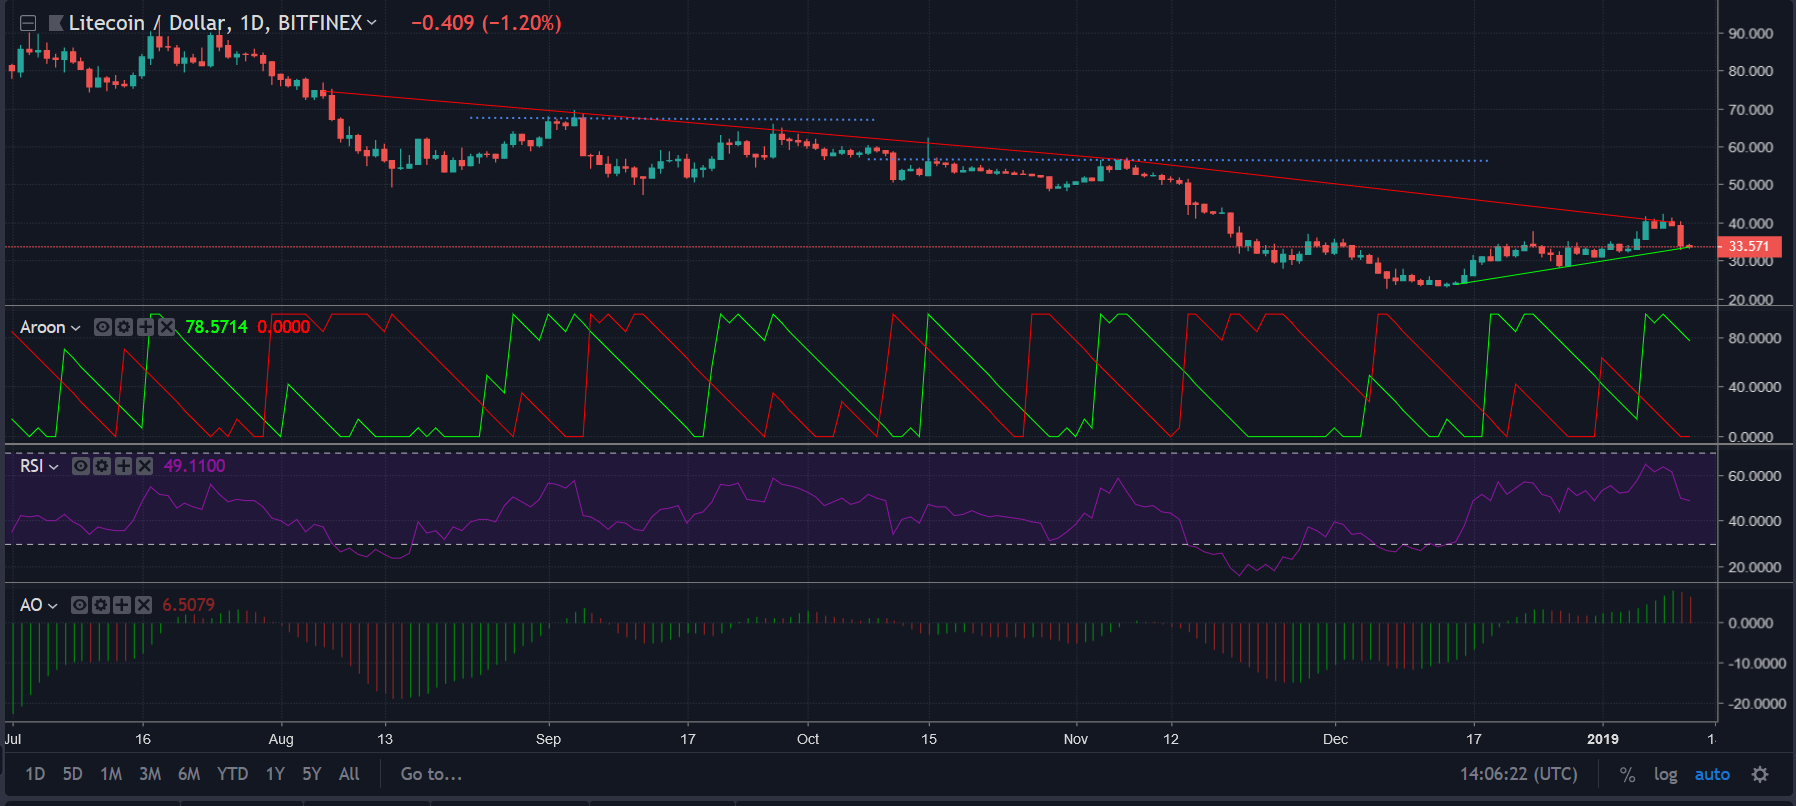
LTC 1 day | Source: TradingView
The daily statistics of Litecoin shows a downtrend extending from $74.7 – $40.2 with resistance points set at $66.8 and $56.34. In this timeframe, the cryptocurrency is also depicting a potential uptrend extending from $23.4 – $33.3.
The Aroon Indicator is showing the dominance of uptrend as the Aroon up line has touched the 100-line. The Aroon down line has reached the 0 level indicating a bullish momentum for the cryptocurrency.
The Relative Strength Index is currently moving within the RSI zone, indicating that the inflow of money in the LTC market is stable in this timeframe.
The Awesome Oscillator is showing a slight transition to red bars, however, it has maintained the formation of the bars above the zero line. This indicates that there is not much fluctuation in the price of the cryptocurrency.
Conclusion:
The technical analysis demonstrates that though LTC suffered from a major downfall in the short term, the indicators are in favor of a fast recovery and a long term bullish run.