Qtum is a PoS-based decentralized blockchain network powered by smart contracts. Its application platform is compatible with current blockchain networks and is agile enough to accommodate new innovative apps. It is an enterprise-grade ecosystem offering customized solutions to various businesses. QTUM is the native token of this network and its technical analysis is as follows:
Past Performance
On Jun 4, 2021, QTUM opened at $12.42. On Jun 10, 2021, QTUM closed at $9.73. Thus, in the past week, the QTUM price has decreased by roughly 22%. In the last 24 hours, QTUM has traded between $9.24-$9.83.
https://s3.tradingview.com/snapshots/r/RTPDHmUt.png
Day-Ahead and Tomorrow
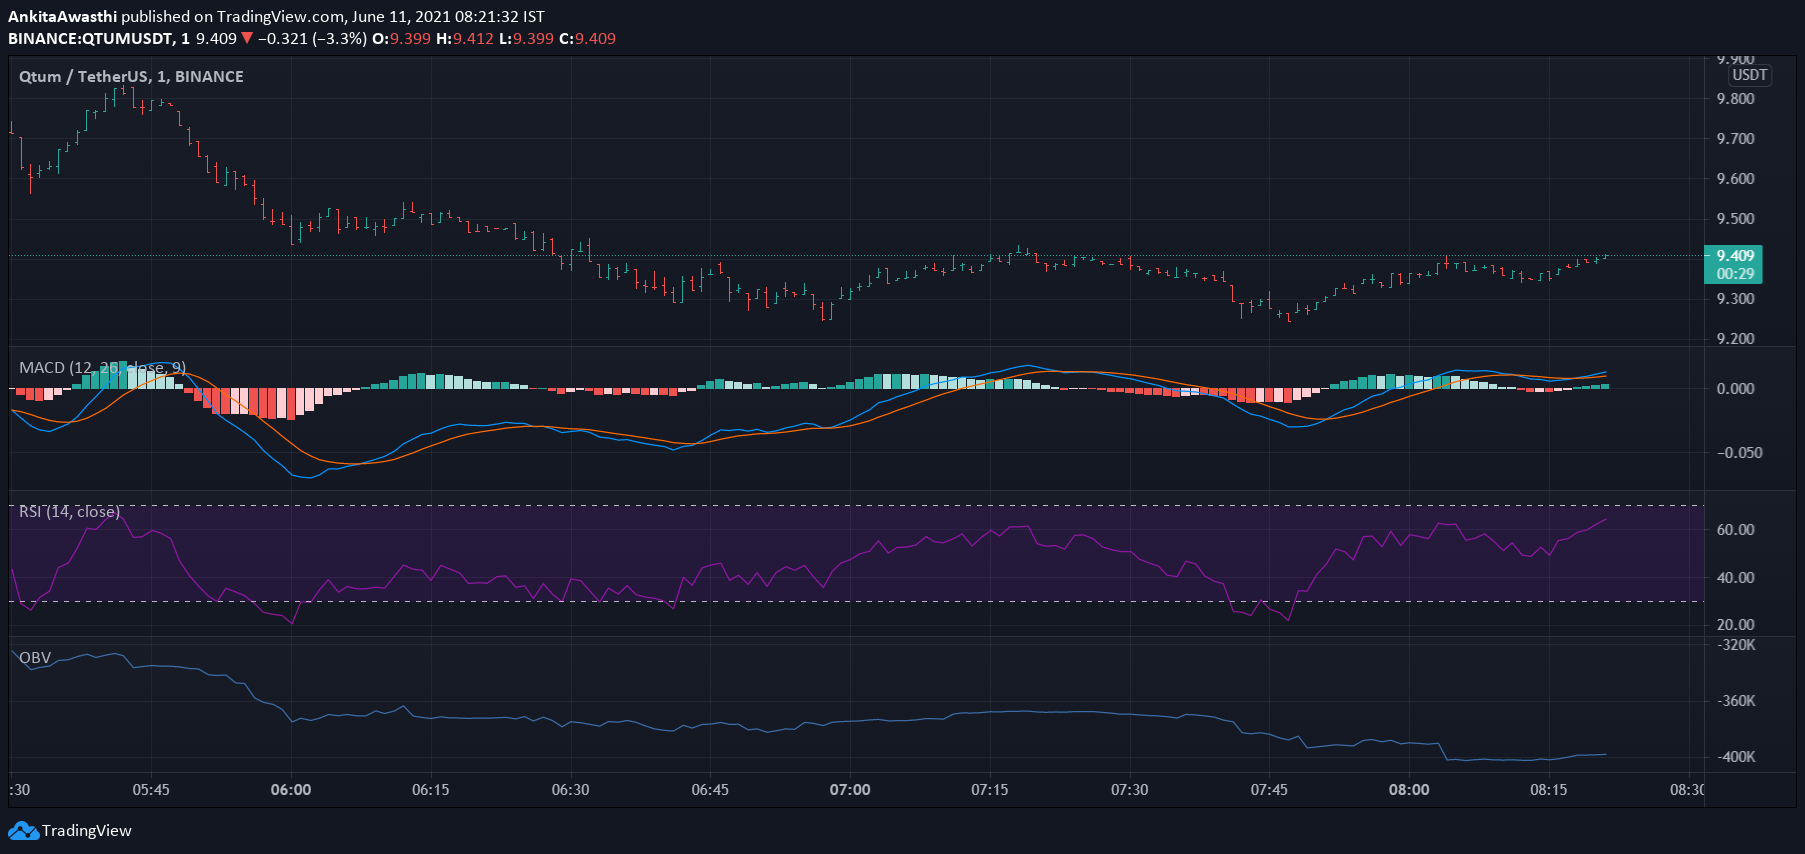
Currently, QTUM is trading at $9.41. The price has decreased from the day’s opening price of $9.73. Thus, the market seems bearish.
The MACD and signal lines are positive. Moreover, a bullish crossover by the MACD line over the signal line has occurred. Thus, the overall market momentum is bullish. Hence, we can expect the price to start rising.
Currently, the RSI indicator is at 68%. It faced rejection at 49% and rose to the current level. Thus, buying pressures are very high. Hence, the RSI oscillator is giving further credence to the bullish market momentum indicated by the MACD oscillator.
However, the OBV indicator is downward sloping. Thus, selling volumes are higher than buying volumes. High selling activity will exert downward pressure on the QTUM price.
In short, when we look at all three oscillators together, we can say that as of now the overall market momentum is positive. However, a trend reversal may be on the horizon. We have to wait and watch if an impending price pullback is temporary or the beginning of a bearish trend.
QTUM Technical Analysis
Currently, the price is below the Fibonacci pivot point of $9.60. The price may soon break out of it and further surpass the first resistance level of $9.82. Thereafter, we have to wait and watch if the price continues to rise or starts falling.
The price has tested and broken out of the 38.2% FIB retracement level of $9.46. It may soon surpass the 50% FIB retracement level of $9.53. By day close, if the price retests and falls below these levels, then probably a price downtrend has set in. In that case, the price may continue to fall tomorrow as well.