KCS is the governance token of the KuCoin blockchain-based cryptocurrency exchange. It is a gain-sharing token that was launched as the ERC-20 token, compatible with the Ethereum (ETH) blockchain network and all ETH wallets. Its incentive-based system allows users to earn passive income. The KCS technical analysis is as follows:
Past Performance
On Jun 4, 2021, KCS opened at $9.52. On Jun 10, 2021, KCS closed at $8.10. Thus, in the past week, the KCS price has decreased by roughly 15%. In the last 24 hours, KCS has traded between $7.91-$8.16.
https://s3.tradingview.com/snapshots/k/K02Cv9Ls.png
Day-Ahead and Tomorrow
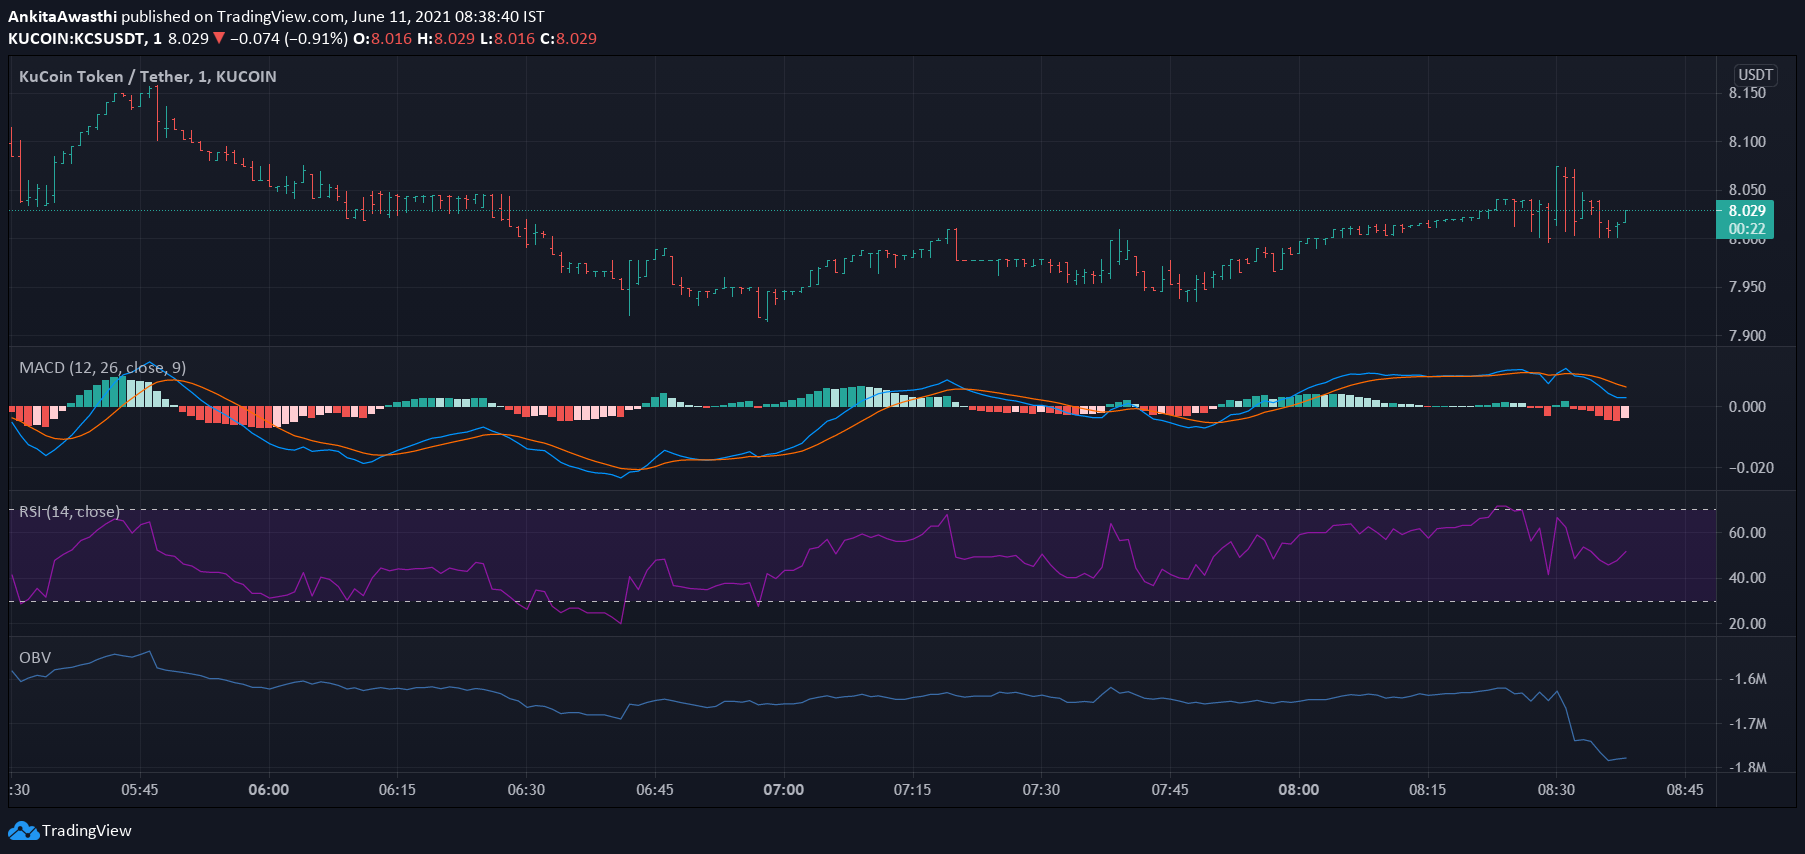
Currently, KCS is trading at $8.03. The price has decreased from the day’s opening price of $8.10. Thus, the market seems bearish.
The MACD and signal lines are positive. Moreover, a bullish crossover by the MACD line over the signal line has occurred. Thus, the overall market momentum is bullish. Hence, we can expect the price to start rising.
Currently, the RSI indicator is at 58%. It faced rejection at 46% and rose to the current level. Thus, buying pressures are slowly building for KCS. Hence, the RSI oscillator is giving further credence to the bullish market momentum indicated by the MACD oscillator.
However, the OBV indicator is downward sloping. Thus, selling volumes are higher than buying volumes. High selling activity will exert downward pressure on the KCS price.
In short, when we look at all three oscillators together, we can say that as of now the overall market momentum is bullish. However, a trend reversal may be on the anvil. We have to wait and watch if an impending price pullback is a temporary corrective price action or the beginning of a bearish trend.
KCS Technical Analysis
Currently, the price is below the Fibonacci pivot point of $8.03. The price may soon break out of it and further surpass the first resistance level of $8.15. Thereafter, we have to wait and watch if the price continues to increase or starts falling.
The price has tested and broken out of the 50% FIB retracement level of $8.03. It may soon surpass the 61.8% FIB retracement level of $8.06. By day end, if the price retests and falls below these levels, then probably a bearish trend has set in. In that case, the price may continue to decline tomorrow as well.