Highlights:
As Bitcoin’s price fell, other cryptocurrencies suffer double. IOTA is not excluded from this huge dip. The bear-run will continue to last until trade takes a trend reversal, expecting bulls’ reaction to resurrect market.
Key Levels:
Resistance levels: $0.35, $0.37, $0.40
Support levels: $0.25, $0.21, $0.18
IOTA-USD Market
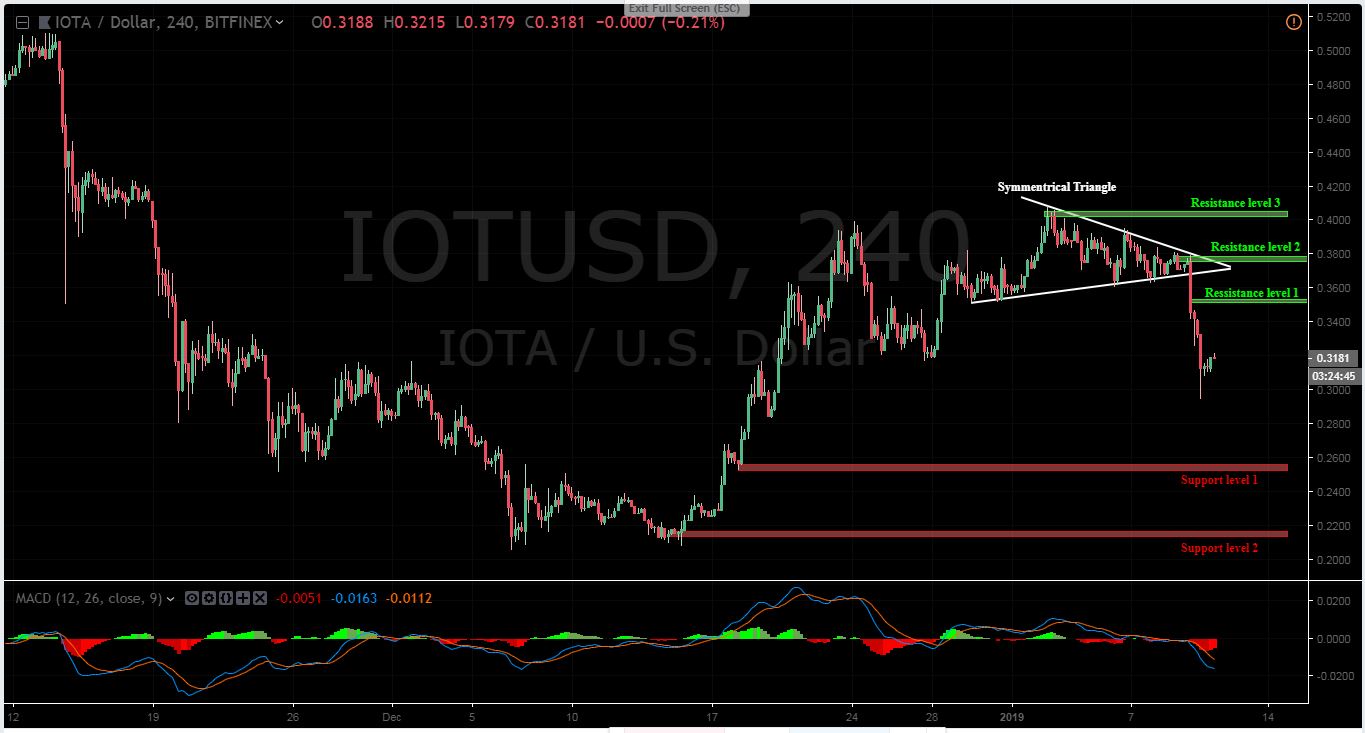
Before yesterday’s drastic drop, IOTA trends in a symmetrical triangle. Selling pressure is rallying price lower to see $0.25 support level. It might further sink to $0.21 support if the bull fails to defend $0.25 position. Once this position is strongly maintained, the price would be forced to re-touch previous resistance.
But as it appears, the big sell-off is not over yet because sellers are still gaining control. Trading is very active and volatility is high. The MACD Oscillator took a downward direction, now sleeping below the zero line. It’s a reflection of yesterday bearish move; breaking down the triangle pattern.
IOTA-BTC Market
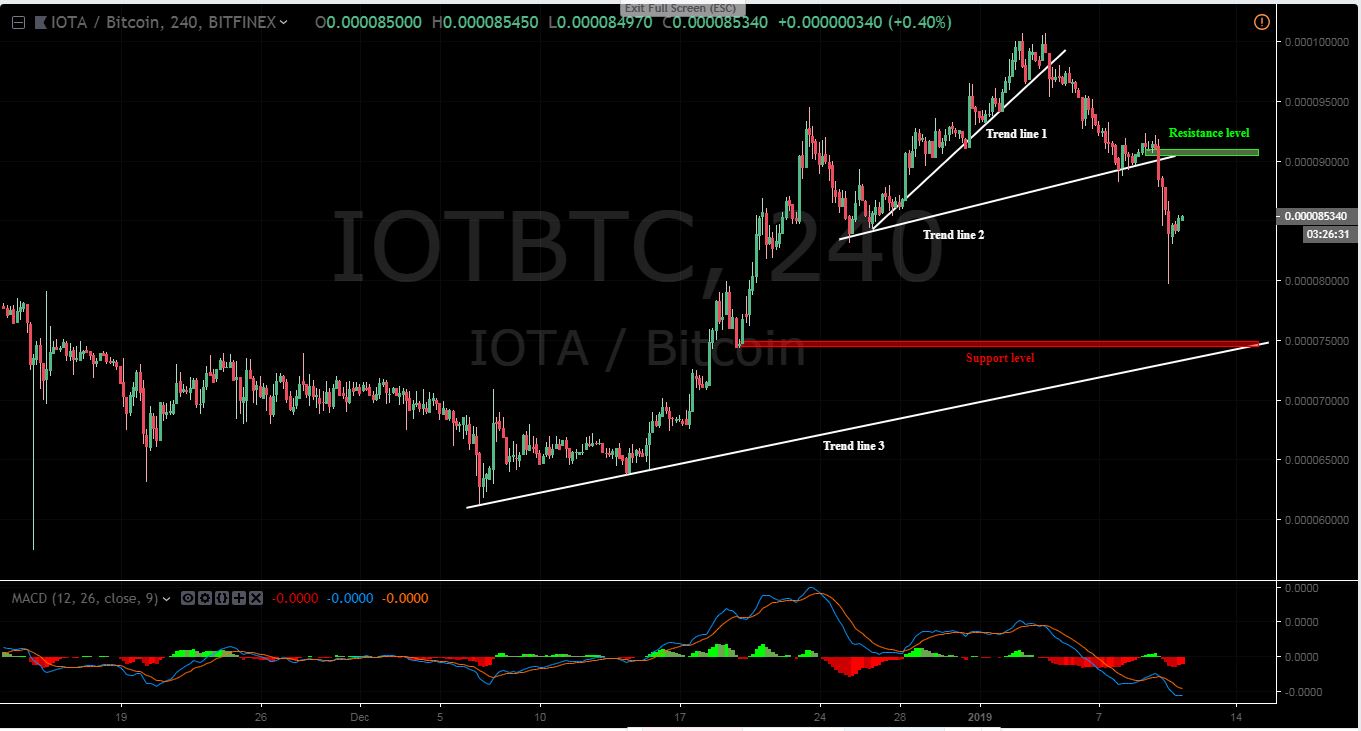
Following the market structure, the price break-in is quite significant on the first and second trend lines with a strong red candle formation. The heavy dump was shown on the 4 hours MACD; oscillating from positive zone to negative.
As at the time of writing, this pair has witnessed 6% change owing to the ongoing fall according to CoinMarketCap.
The current drive is about to make a bottom at the third trend line, where 7500 SAT support level lies. At the mentioned support, a retracement is likely to re-visit the 9100 SAT resistance (trend line 2) before bouncing back downward.
Please note: Cryptovibes.com is not a financial advisor. Do your own research before investing in any financial asset. We are not responsible for your investing results.
Follow us on Facebook , Twitter and Telegram