As per our new technical analysis on TERRA (LUNA), it offers fast and affordable settlements and uses stable coins to power a price-stable payment system. Stable coins are coins that are pegged to fiat currency, such as USDT.
Past Performance
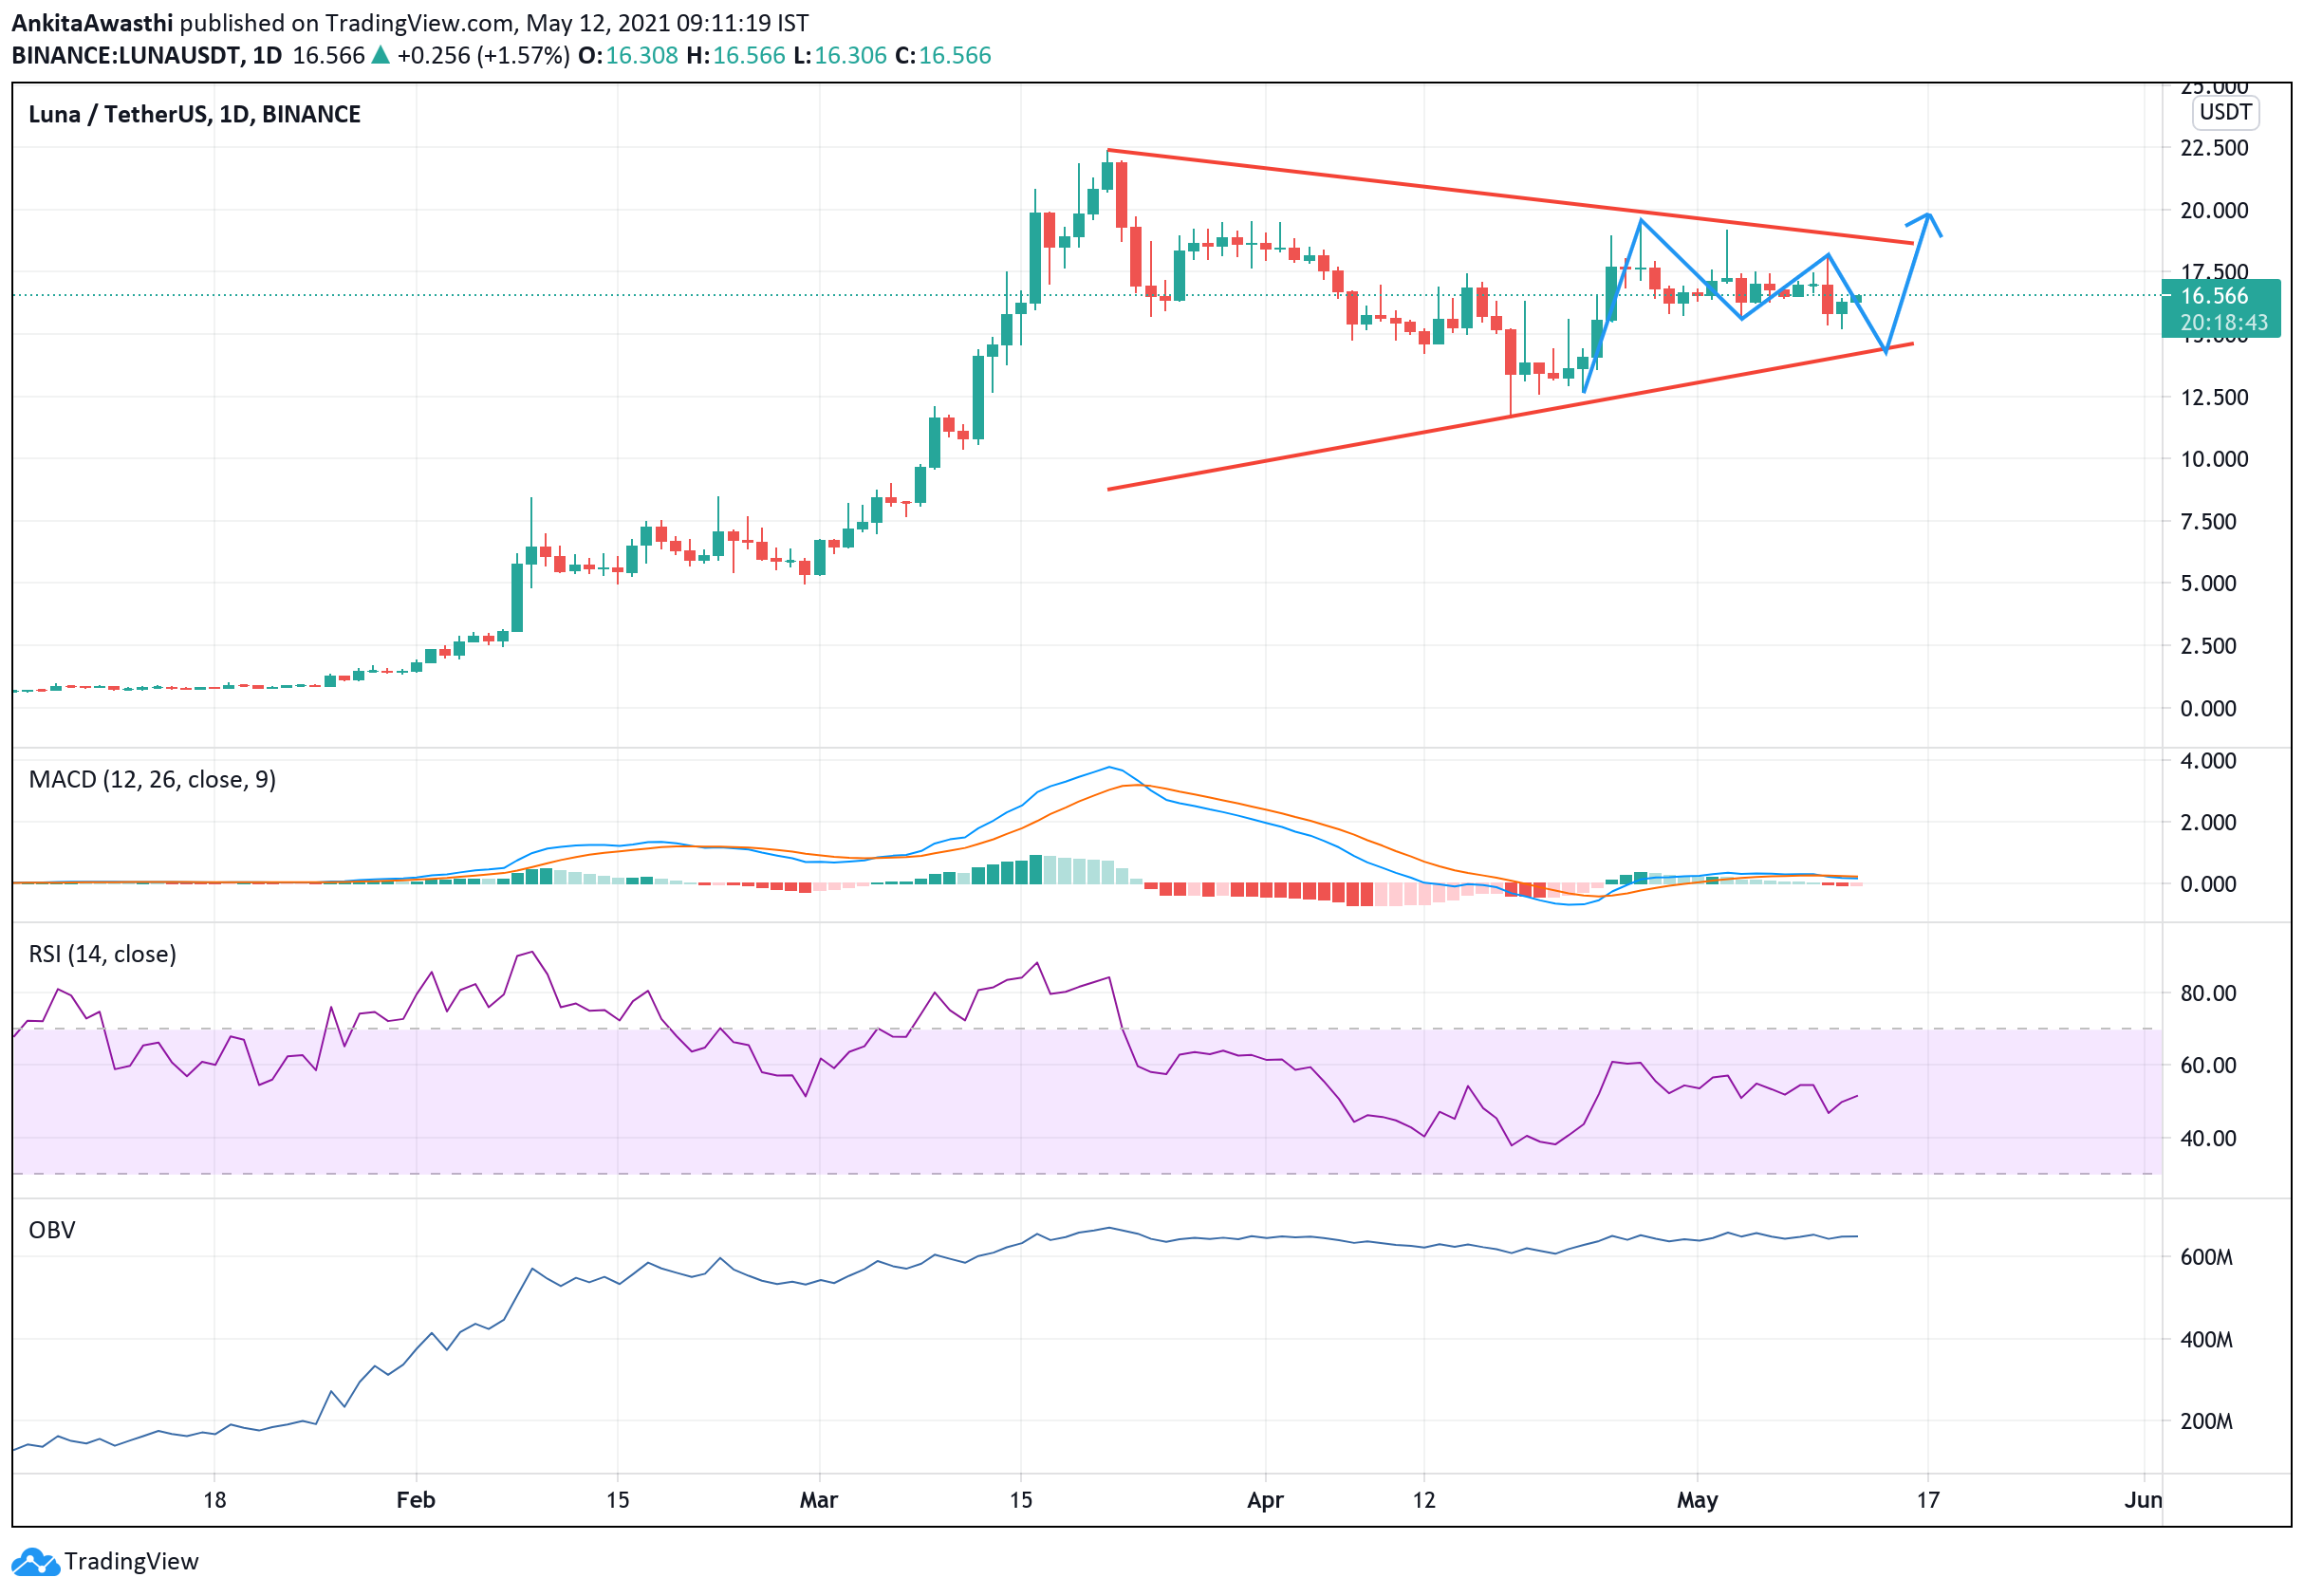
The last seven-day data of LUNA shows it has traded between $15.25 to $17.51. Although, it has touched an all-time high of $22.33, currently 26.44% down from its ATH.
Link:https://www.tradingview.com/x/RyMBAaHI/
Day Ahead And Tomorrow
In the past 24 hours, LUNA has been very volatile. The price change has been $0.81 from a price of $15.67 which is a 5.75% increase. At the time of press, LUNA is trading at $16.84.
On the daily chart, MACD is just above the half-line thus following the trend that the chart has been making. The lagging indicator is indicating that the price will continue in the same trend for a while. The signal line has more potential to cross from below, thus indicating a bullish trend.
Even the RSI has been trading at 54%, just above the equilibrium. RSI has enough potential to go towards the overbought region. RSI has indicated a trend reversal, and thus a trader can take a long position from here.
OBV predicts the volume flow, which is expected to be very high. If the indicators are supported by volume, LUNA can see a breakout from the current zone.
LUNA Technical Analysis
The important level to look out for is a strong resistance seen at $19.779. It has great potential to test that level. If it breaks the level it can see a breakout and will highlight the level of $22, which will be our next target.
On the other hand, if it retests the support zone, which is $14.06, and breaks the level. We will assume a bearish trend, and traders can short the position from that level.