Hard and Kava protocol technical analysis points to weakness. KAVA/USDT and HARD/USDT are in range mode at around Apr 2021 highs but could rise to $11 and $2.6, respectively.
Kava Protocol (KAVA)
The Cross-chain DeFi ecosystem is growing, and Kava is spearheading this novel push. The interoperable blockchain has its native currency, KAVA, for governance.
Past Performance of KAVA
The KAVA/USDT price remains in an uptrend through struggling to reverse losses of mid-April.
As of writing on May 4, the KAVA price is changing hands at $6, relatively stable versus the greenback but adding six percent against BTC. It is trailing ETH, dropping three percent. Meanwhile, trading volumes are up 2.8x on the last day to $179 million.
Day-Ahead and What to Expect
The path of the least resistance remains northwards. Aforementioned, there is participation. However, the immediate sell wall is at Q1 2021 and April 2021 highs at $7.5.
KAVA/USDT found support from around the 50 percent Fibonacci retracement level of the Q1 2021 trade range. Consequently, the coin may blast past $7.5 in a buy trend continuation pattern.
KAVA/USDT Price Forecast
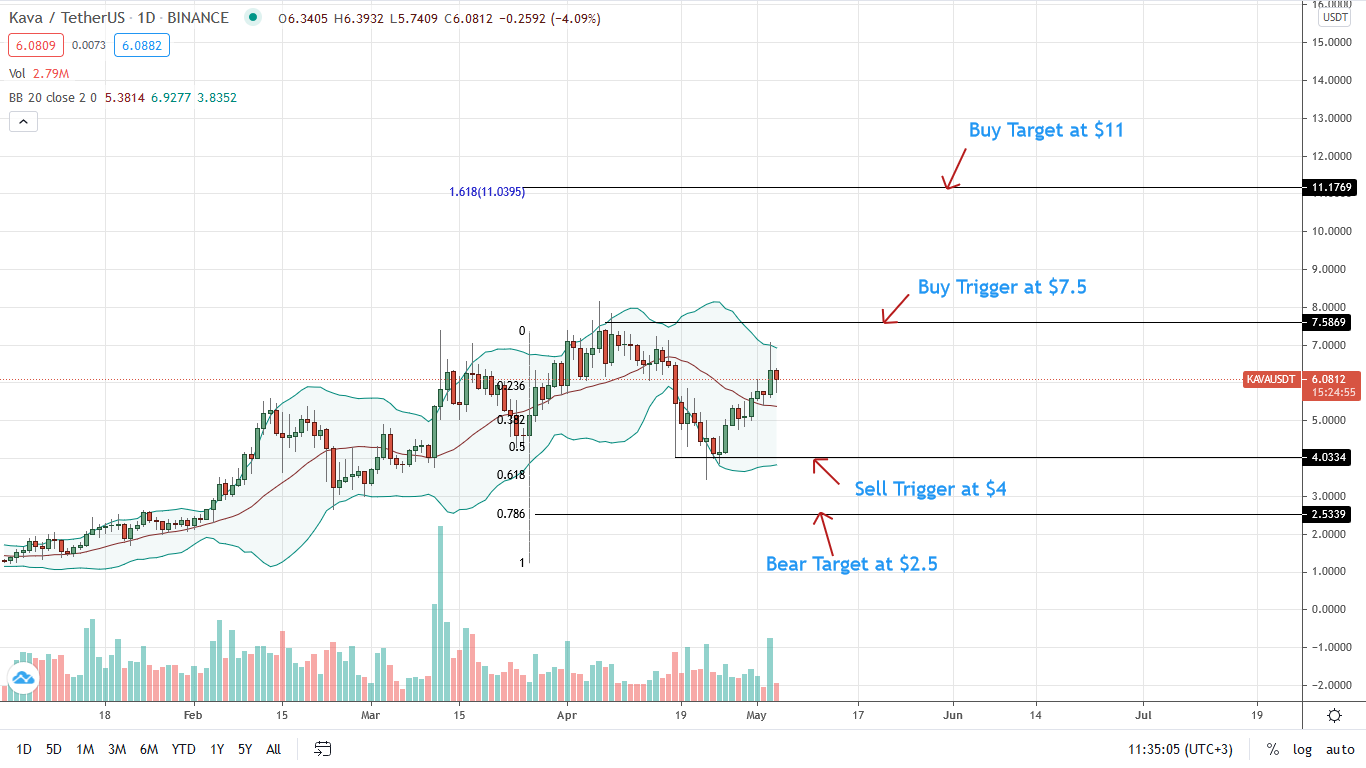
KAVA technical analysis points to bulls who also appear exhausted. From the daily chart, a close above $7.5 confirms bullish efforts of late Apr 2021.
It could catalyze demand, triggering buyers who would, in turn, aim for $11—the 1.618 Fibonacci extension level of the Q1 2021 trade range.
Losses below $4 cast doubt on the uptrend. Sellers, in this case, may see KAVA fall to $2.5.
Hard Protocol (HARD)
The Hard Protocol is a decentralized moneymaker operating on the Kava protocol. HARD is the protocol’s governance token.
Past Performance of HARD
The Hard protocol technical analysis appears to track KAVA’s performance. As of writing on May 4, the HARD price is on an uptrend, contracting slightly versus the greenback.
Trading at $1.72, the token is oscillating within a $0.07 zone with reaction levels at $1.69 and $1.90 on the last day. At the same time, HARD trading volumes on the last day are stable at $18 million.
Day-Ahead and What to Expect
The HARD/USDT price remains in range inside a two-month zone traced back to late Feb 2021. Identifiable support and resistance lie at $1.2 and $2.6, respectively.
Depending on the breakout direction, this oscillation could turn to be either distribution or accumulation.
HARD/USDT Price Analysis
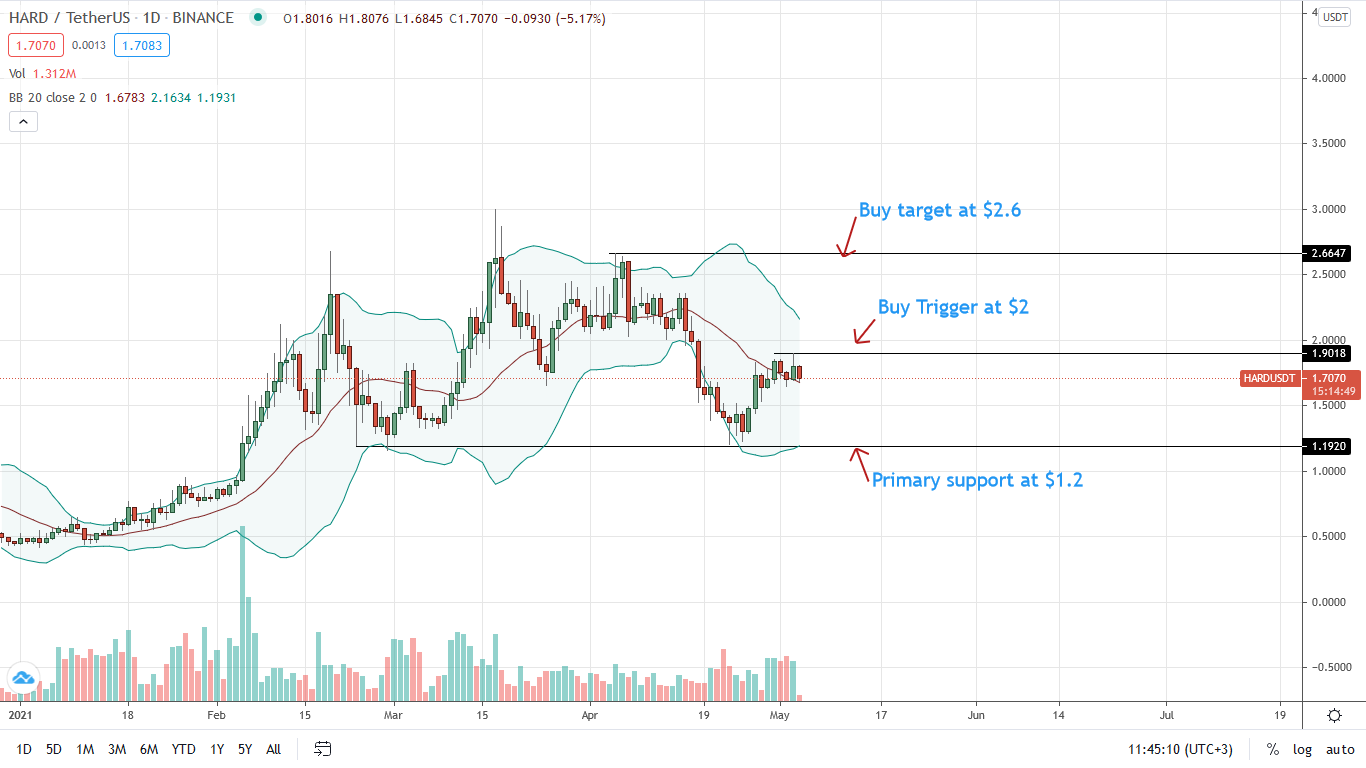
HARD buyers are still in control. In the immediate term, a close above $2 may trigger aggressive HARD bulls. As a result, the first bull target is Apr 2021 highs of around $2.6. Losses below $1.2 may catalyze a dump down in a correction.