The OMG Network is a non-custodial, trustless, fast, secure, and cost-effective blockchain platform for transferring value on the Ethereum blockchain. It facilitates real-time and borderless transactions in digital currencies thereby supporting a wide range of banking and finance activities. OMG is the prime governance token of this ecosystem.
Past Trends
On April 27, 2021, OMG started trading at $7.11. On May 3, 2021, OMG closed at $9.34. Thus, in the past week, the OMG price has surged by roughly 31%. In the last 24 hours, OMG has traded between $8.38-$9.35.
https://s3.tradingview.com/snapshots/b/bw7ehnGk.png
Day-Ahead and Tomorrow
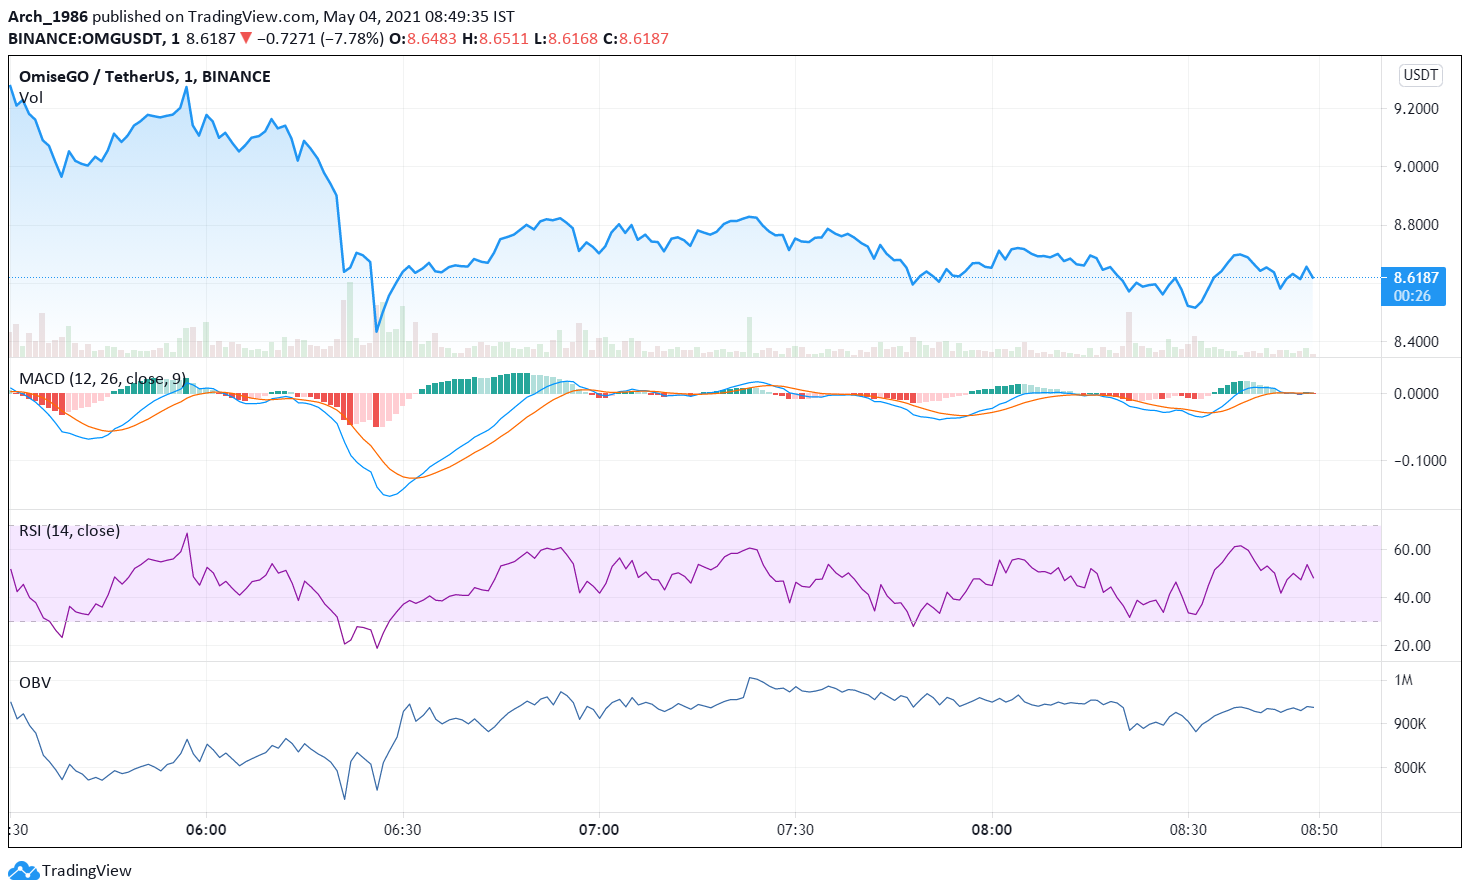
Currently, OMG is trading at $8.62. The price has decreased from the day’s opening price of $9.34. Thus, the market seems to be downtick.
The MACD and signal lines are positive. Moreover, a bullish crossover by the MACD line over the signal line has occurred. Thus, the overall market momentum is bullish. Hence, we can expect the OMG price to start rising in some time.
The RSI indicator faced rejection at 62% and is currently at 54%. Thus, selling pressures are slowly increasing. In conjunction with the MACD oscillator, we can say that the price drop may continue for some more time. Thereafter, as buying volumes surpass selling volumes, the price may start rising.
The OBV indicator is upward sloping. However, it has started declining slightly. This implies that as of now buying volumes are high, but selling volumes are slowly mounting.
When we look at all the oscillators together, we have received mixed signals. As of now, the price has started rising slowly. So, probably a bearish trend reversal has occurred. However, we have to wait and watch to see if this price upswing sustains till day end.
OMG Technical Analysis
Currently, the price is above the first Fibonacci pivot support level of $8.65. If the bulls remain strong, then the price may break out of the first Fibonacci pivot resistance level of $9.39 in some time.
The price has tested and broken out of the 23.6% FIB retracement level of $8.60. Thus, as of now, we can say that the bulls are slowly gaining strength. In that case, the price uptrend may continue today and tomorrow.