Dogecoin’s (DOGE) massive rally to $0.45 propelled it to a market capitalization of over $54 billion to make it the fifth most valuable cryptocurrency by market cap.
This lofty market cap comes as a surprise to many since the project has no active developers and is only a meme coin, thus the current rally brings back memories of the excesses seen during the ICO boom in 2017.
Rallies like the one seen in Dogecoin indicate that several traders have entered the fray and are looking to get rich overnight. The only positive sign is that the mania has not spread to other coins. If it does, then the crypto markets are likely to witness a sharp correction in order to shake out the weak hands.
CNBC host Jim Cramer has become one of the first well-known people to reveal that he closed half of his Bitcoin (BTC) position. While Cramer’s selling is an isolated event, it does warn that not all professional investors who have recently turned Bitcoin believers are going to be long-term HODLers.
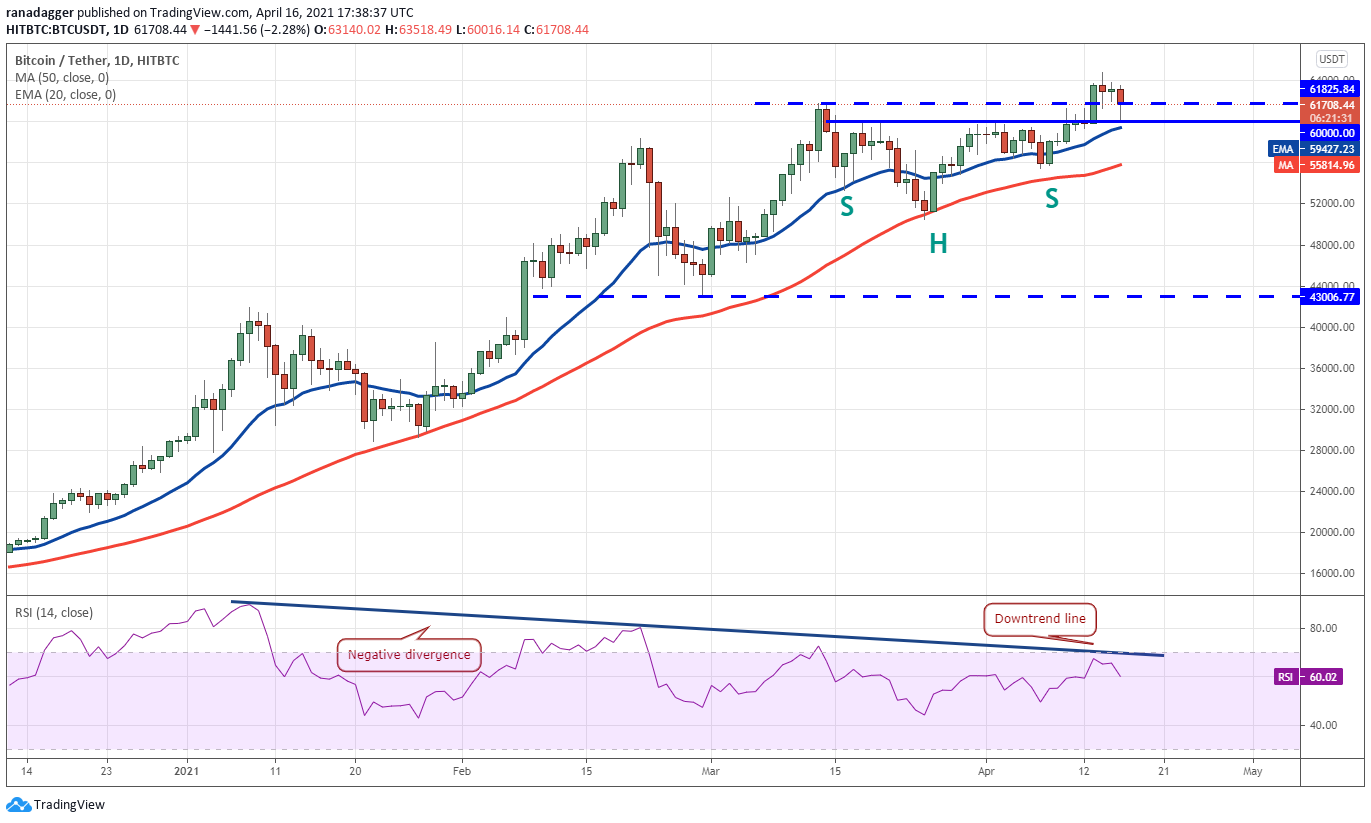
If they manage to do that, the BTC/USDT pair may make one more attempt to resume the uptrend. A breakout of $64,849.27, could start the next leg of the uptrend that could reach $69,540 and then $79,566.
However, the negative divergence on the relative strength index (RSI) is warning of a possible correction. Interestingly, the price reversed direction when the RSI had reached close to the downtrend line.
If the price dips below the 20-day exponential moving average ($59,427), it will be the first sign that buyers may be losing their grip. The break below the 50-day simple moving average ($55,814) will further cement the view that a deeper correction is likely.
The bulls may attempt to arrest the decline near $50,460.02 but if this level cracks, the pair could drop to the critical support at $43,006.77.
ETH/USDT
Ether (ETH) extended its uptrend and hit an all-time high at $2,545.80 today. Profit-booking by traders pulled the price down to $2,300 but the long tail on the day’s candlestick suggests that bulls continue to buy on dips.
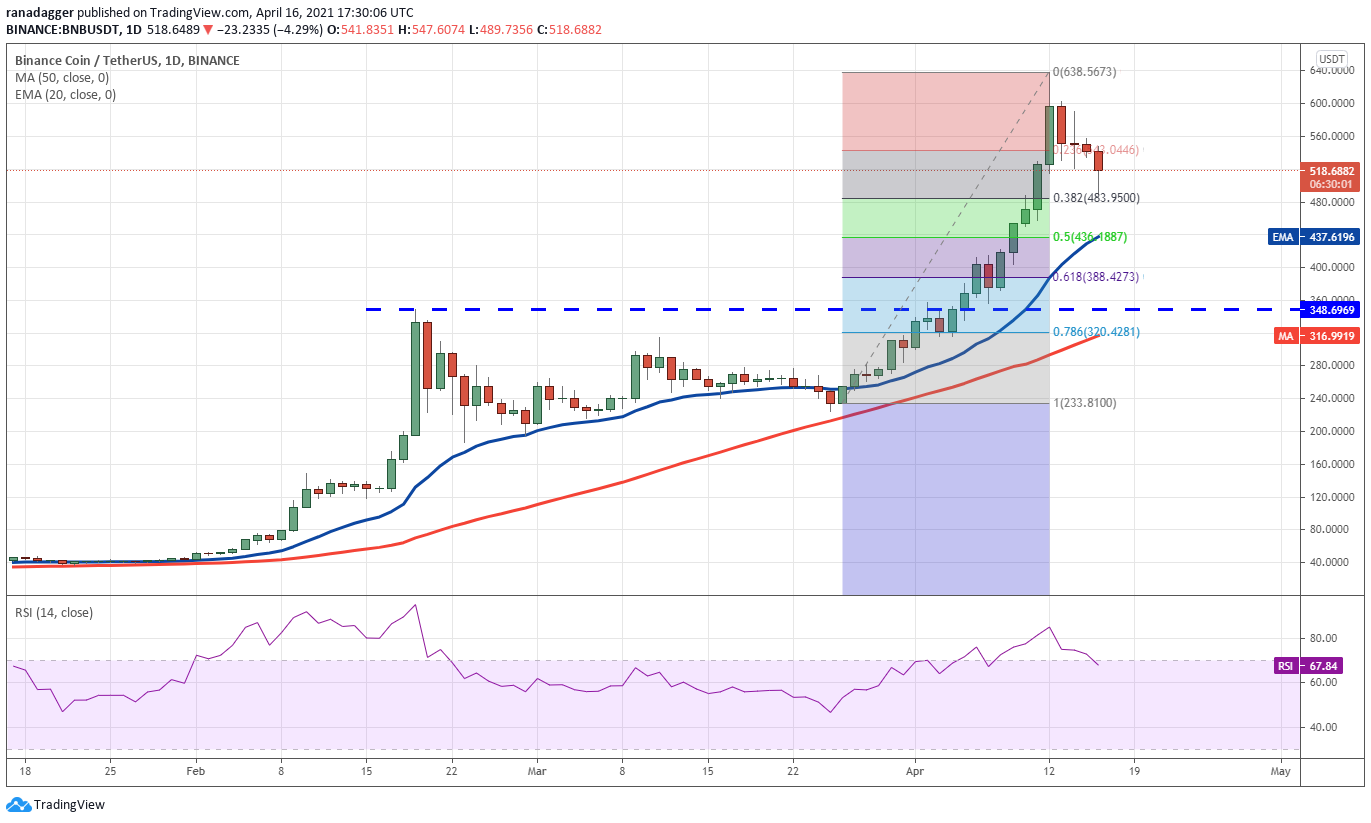
However, a minor positive is that the bulls are defending the 38.2% Fibonacci retracement level at $483.95, as seen from the long tail on the day’s candlestick. The bulls will now try to push the BNB/USDT pair above the all-time high at $638.56 and resume the uptrend.
Conversely, a break below $483.95 could pull the price down to the 20-day EMA ($437). A break below this support will suggest that the traders are rushing to the exit and that could result in a drop to the breakout level at $348.69.
XRP/USDT
XRP is currently correcting the sharp rally. The bulls are attempting to defend the first support at the 38.2% Fibonacci retracement level at $1.48, as seen from the long tail on the day’s candlestick.
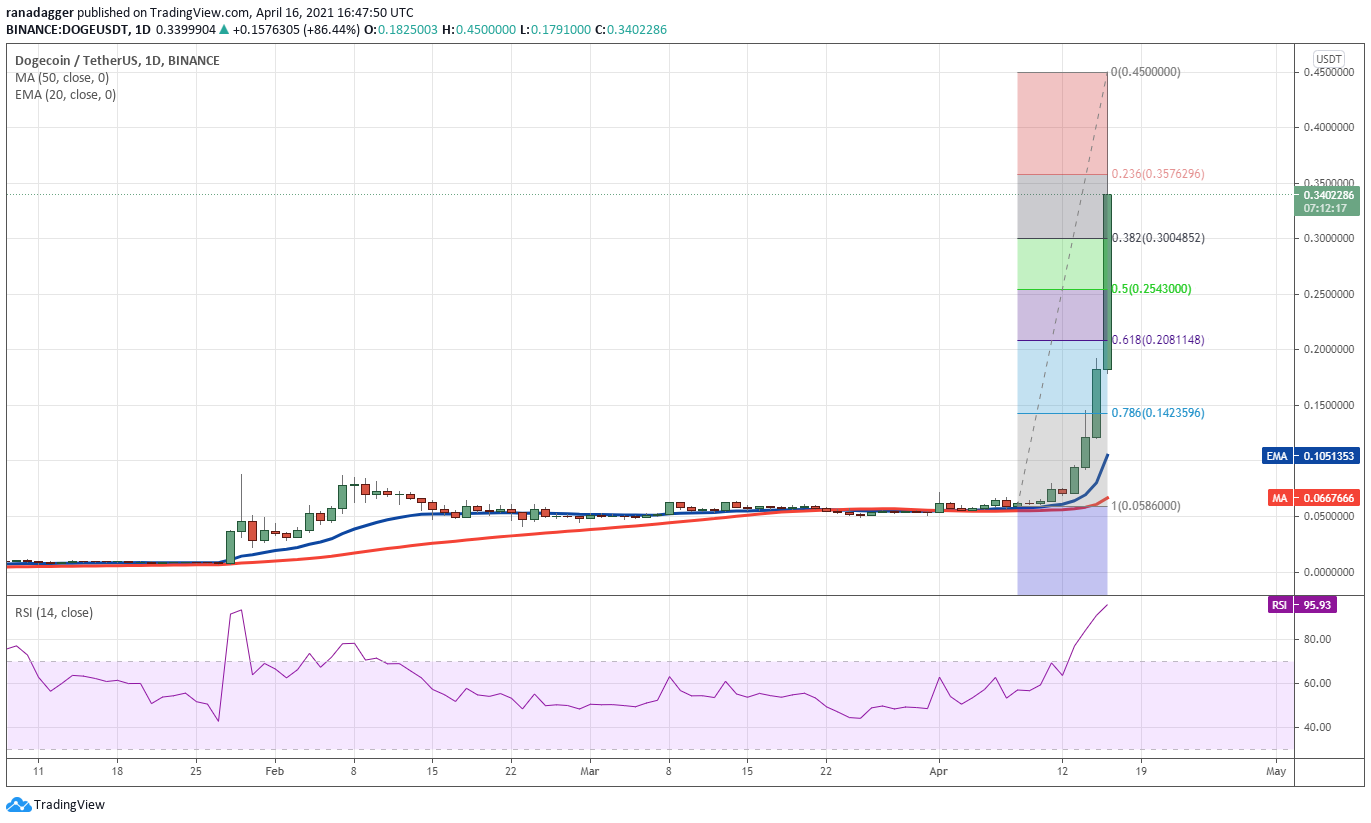
Usually, such buying frenzies end in a major top formation. After the last bull has purchased, the price reverses direction and the waterfall decline starts. It is difficult to predict a top during such a frenzy but the psychological $0.50 level may act as a hurdle.
The decline after the DOGE/USDT pair tops out is likely to be vicious. The usual 38.2% Fibonacci retracement level may not hold and the pair is likely to drop to the 61.8% Fibonacci retracement level at $0.20.
Traders should control the urge to get into such trades even at the risk of missing out on some profits.
ADA/USDT
Cardano (ADA) has been facing a tough battle between the bull and the bears near $1.48 for the past two days. Although the bulls managed to push the price above $1.48 today, the bears have been quick to pull the price back below the level.
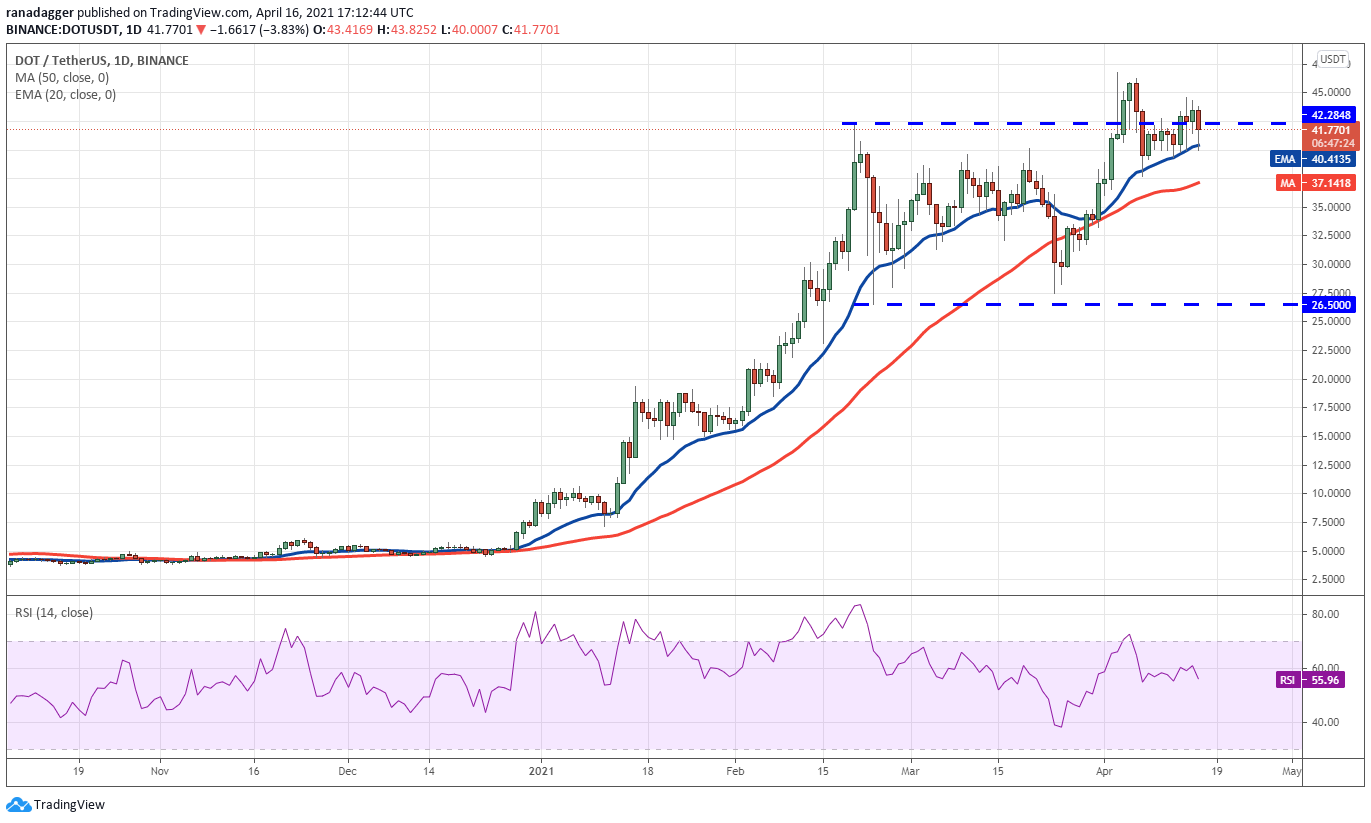
If they succeed, the selling could pick up further as the bulls may rush to cover their positions. Such a move could sink the DOT/USDT pair to $32.50 and then to the critical support at $26.50.
Contrary to this assumption, if the price again rebounds off the 20-day EMA, it will suggest that bulls have not given up. They will make one more attempt to thrust the price above the $46.80 resistance and resume the uptrend.
LTC/USDT
Litecoin (LTC) is in a strong uptrend. The bears had tried to start a correction today but the bulls purchased the dips aggressively as seen from the long tail on the day’s candlestick. The reversal may have caught several aggressive bears on the wrong foot, which could be the reason for the pick-up in momentum.
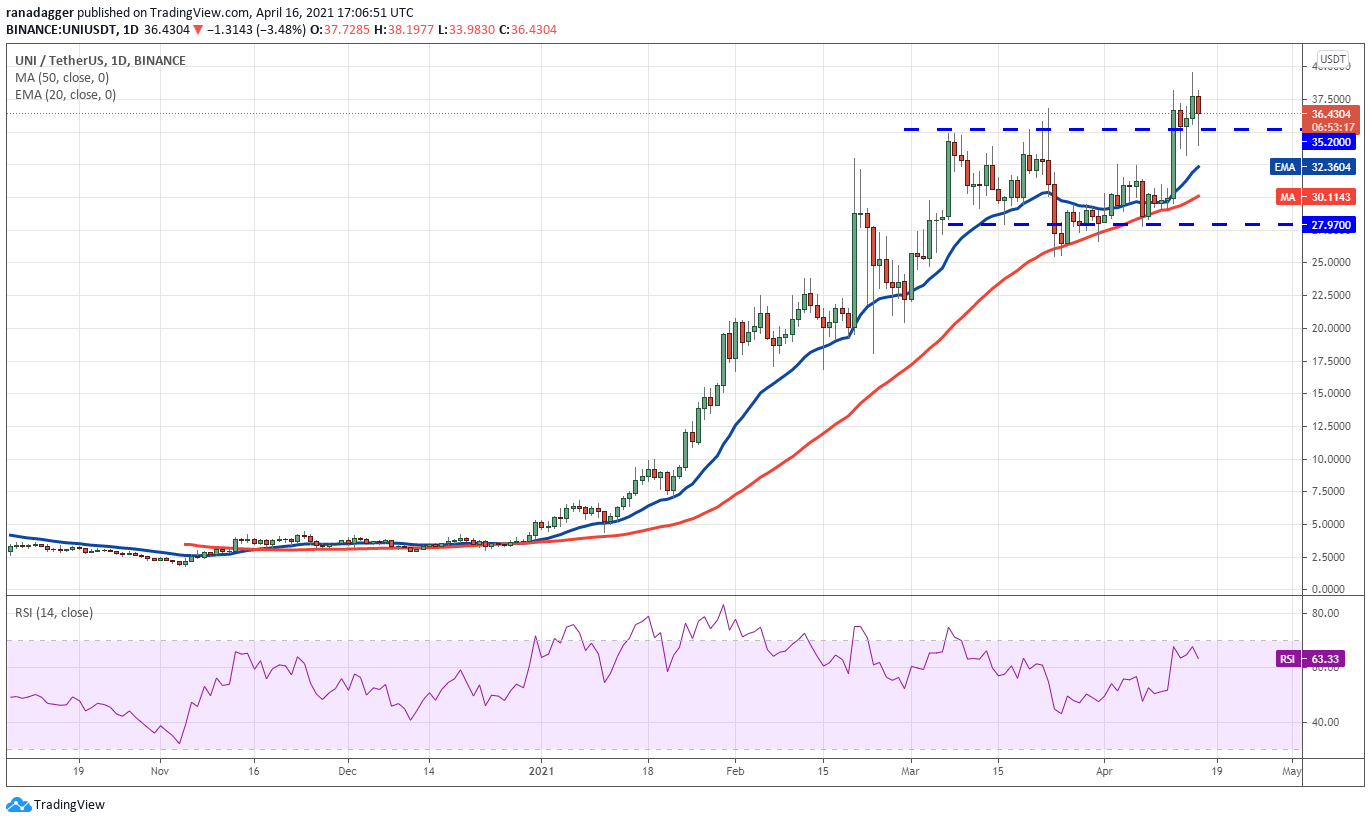
However, the long tail on the day’s candlestick suggests the bulls continue to buy on dips. If the buyers can propel the price above the all-time high at $39.60, the UNI/USDT pair could rally to $43.43 and then $50.
On the other hand, if the price again turns down and breaks below the 20-day EMA ($32), several aggressive bulls who had purchased the breakout of $35.20 may bail out of their positions. The long liquidation could pull the price down to $27.97.
LINK/USDT
Chainlink (LINK) surged above the $36.93 overhead resistance on April 14, signaling the resumption of the uptrend. The altcoin hit an all-time high at $44.33 where profit-booking set in.
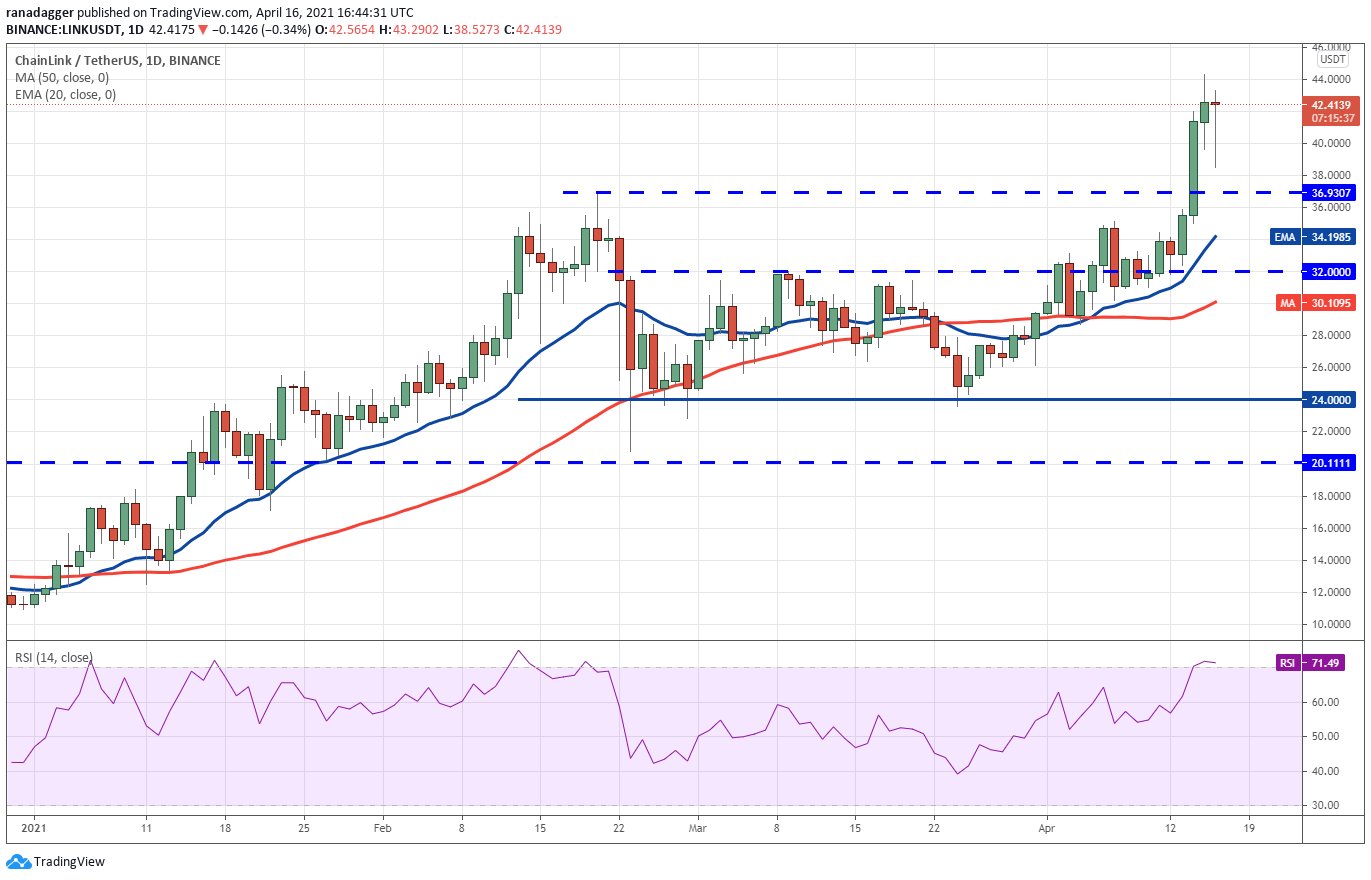
However, the long tail on the day’s candlestick suggests that the bulls aggressively purchased the dip to $38.52 today. This indicates that the sentiment remains positive and the bulls are buying at lower levels.
The buyers will now try to resume the uptrend by pushing the price above $44.33. If they succeed, the LINK/USDT pair could rally to $50.
Contrary to this assumption, if the price again turns down and breaks below the $36.93 support, the pair could drop to the 20-day EMA ($34). If this support cracks, the decline could extend to the 50-day SMA ($30).
The views and opinions expressed here are solely those of the author and do not necessarily reflect the views of Cointelegraph. Every investment and trading move involves risk. You should conduct your own research when making a decision.
Market data is provided by HitBTC exchange.