- HNT coin price increased 250% from the uptrend initiated in March, which could have boosted 350%, but the price dipped approx $4 in the last week
- The coin price of HNT is around $15, and the trend is yet to be determined. An up move could increase the coin price by approximately 30%
- Helium coin outperformed bitcoin and gave 200% more return in March and April
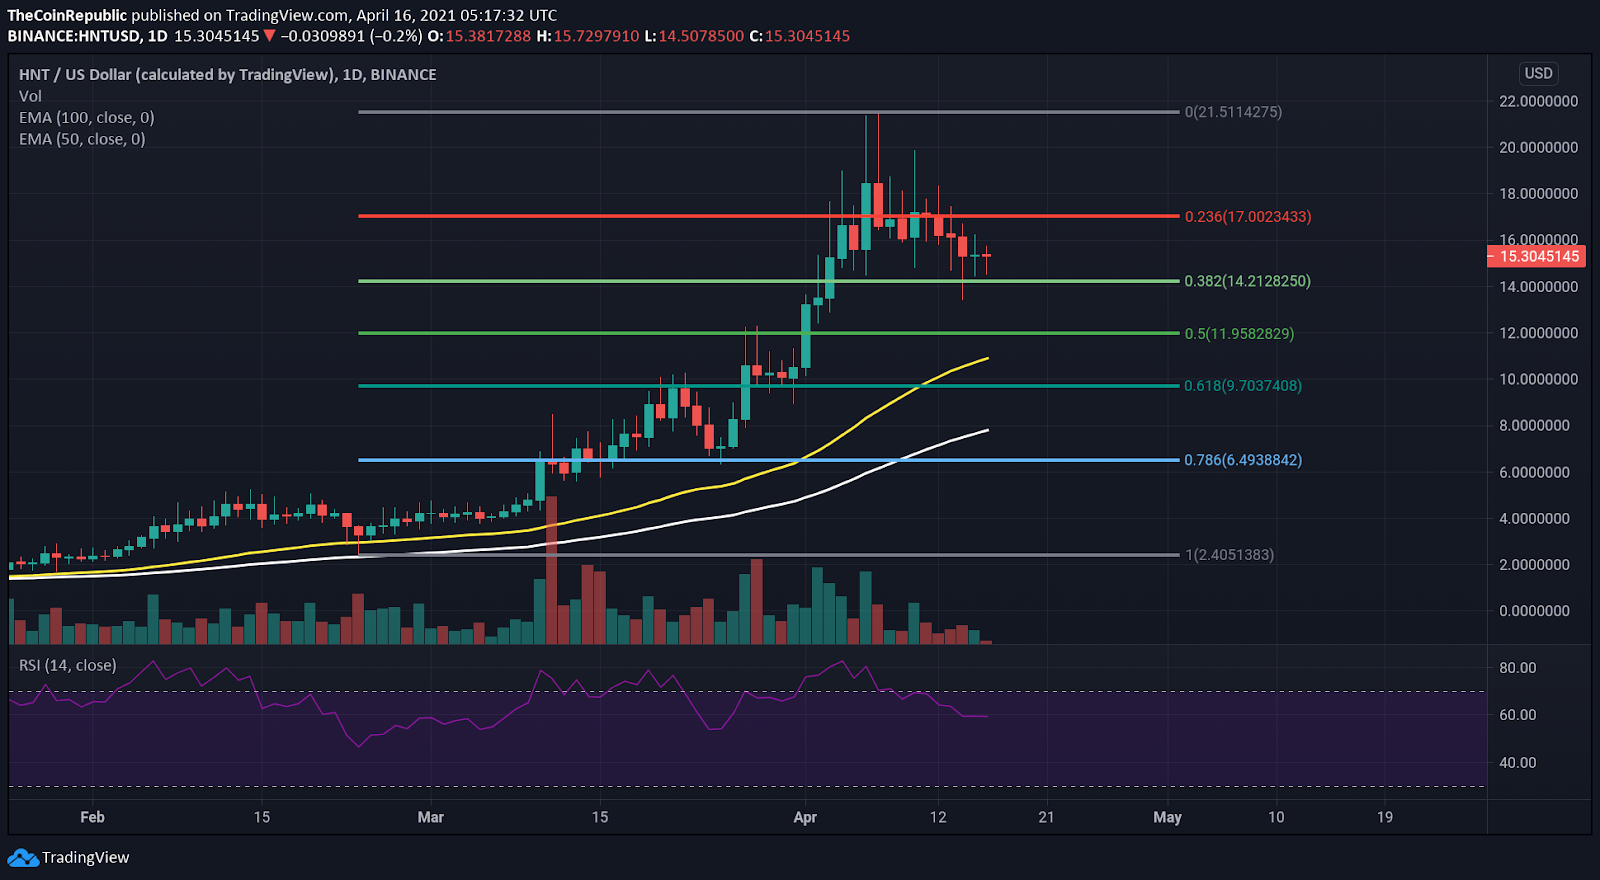
Helium Coin price is hovering near $15 and the uptrend reinitiated April has shown more than 50% growth, excluding the rejection from the $19 level. The current price is near the Fibonacci level of 0.382, i.e. $14.20. The decrease in volume of the recent downtrend implies it is a pullback by HNT coin price before restarting the uptrend. In the daily timeframe, the 50 EMA(yellow) is above the 100 EMA(white), which implies a bullish trend. The RSI in the daily timeframe is sloping down near previous support, where it could restart the trend towards the overbought zone. The HNT coin price has been as low as $1.19 and as high as $21 from January 2021.The market capitalization of the HELIUM is $1,189,433,372 (-0.19%) and the 24-hour volume is $15,943,794 (-36.18%).
Potential of crossing the $19 mark
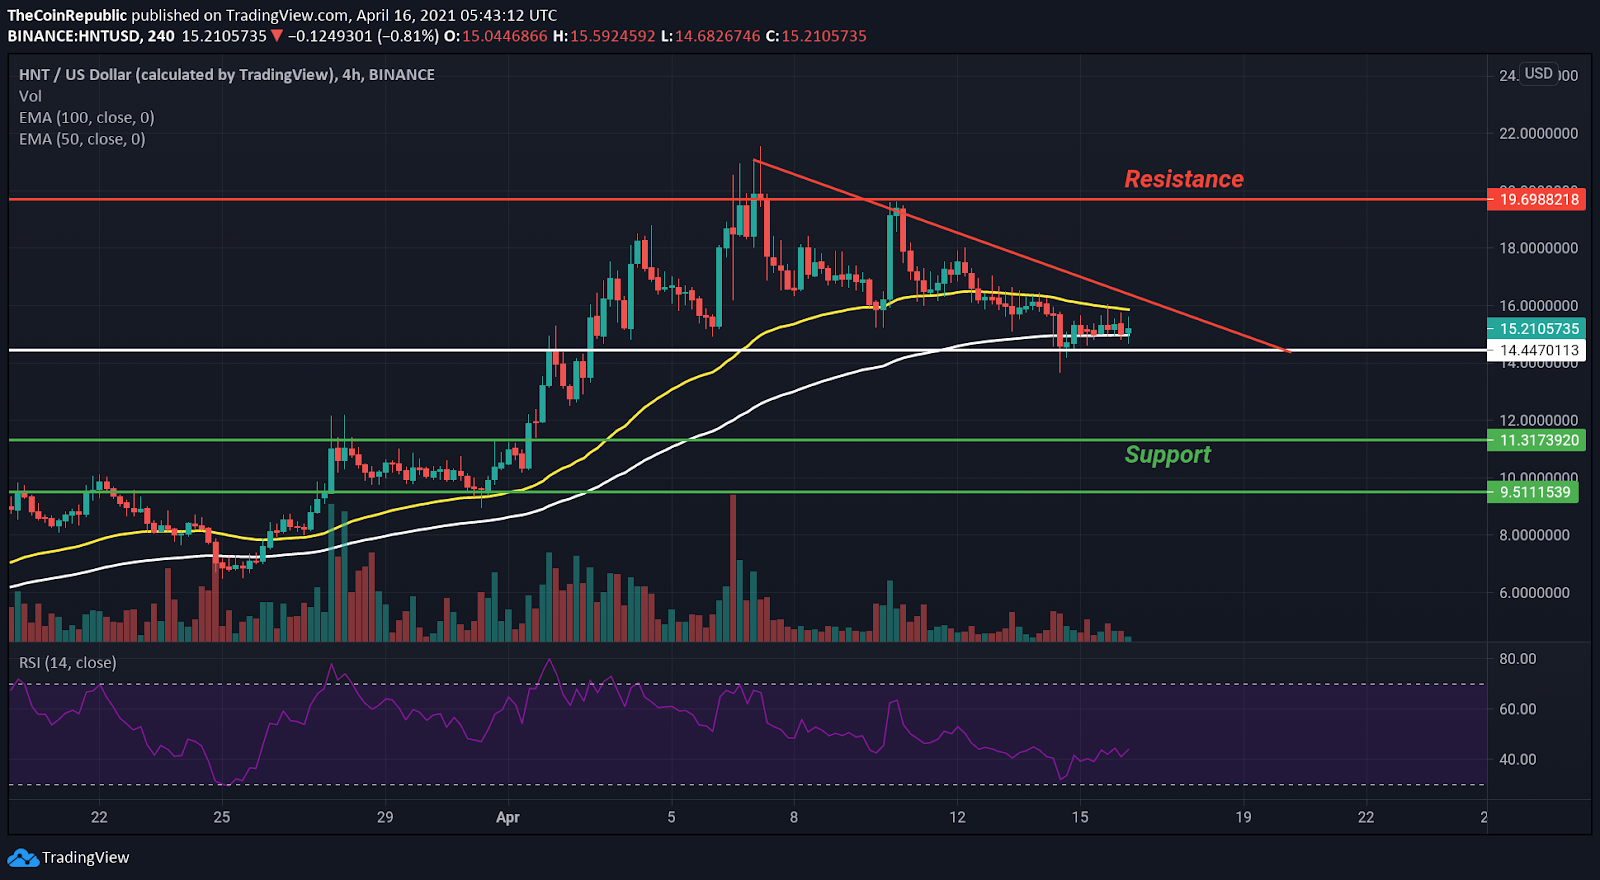
Helium coin price is in a declining trend for now, but the low selling volume associated with the trend reveals its underlying weakness. The price is near the support level of $14.40, and by the looks of the Doji formed in the daily timeframe, the indecision in traders sentiments are expressed. Doji formed near support levels are considered to indicate a change in trend. However, the descending triangle pattern is supposed to be bearish, but the upside breakout of such a pattern is also very common. An up move after the breakout of the resistance trendline could lead price above $19, the previous high. Whereas the fallout is expected to lead to a price as low as $11 at least.
The price is gripped close to 100EMA(white) below 50 EMA(yellow) in the 4-hour timeframe conveying bullish sentiments. However, the proximity of the two EMA brings the possibility of a bearish crossover, but the increase in buying volume can make the ema move upwards.
The relative strength indicator is in the neutral region close to 45, but the slow uptrend of RSI could be expected to speed up with an increase in volume.
CONCLUSION
Early traders must wait for the price to break the descending triangle as multiple factors play essential roles for now. However, a breakout of either side will bring the price to the immediate support/resistance level.
Support – $11, $9 and the mentioned Ema
Resistance – $19.6