On Monday Visa Inc announced that it had launched a pilot program with Crypto.com to enable its partners to settle fiat transactions by sending USD Coin (USDC) stablecoin to Visa’s Ethereum address at Anchorage digital bank. This step by Visa shows that legacy finance companies are increasing their adoption of cryptocurrencies.
According to a PwC report reviewed by Bloomberg, crypto mergers and acquisitions soared to $1.1 billion in 2020 compared to $481 million in 2019. The increase in these deals is likely to surpass the 2020 numbers on every single metric with the arrival of large investors and institutional players according to PwC global crypto leader Henri Arslanian.
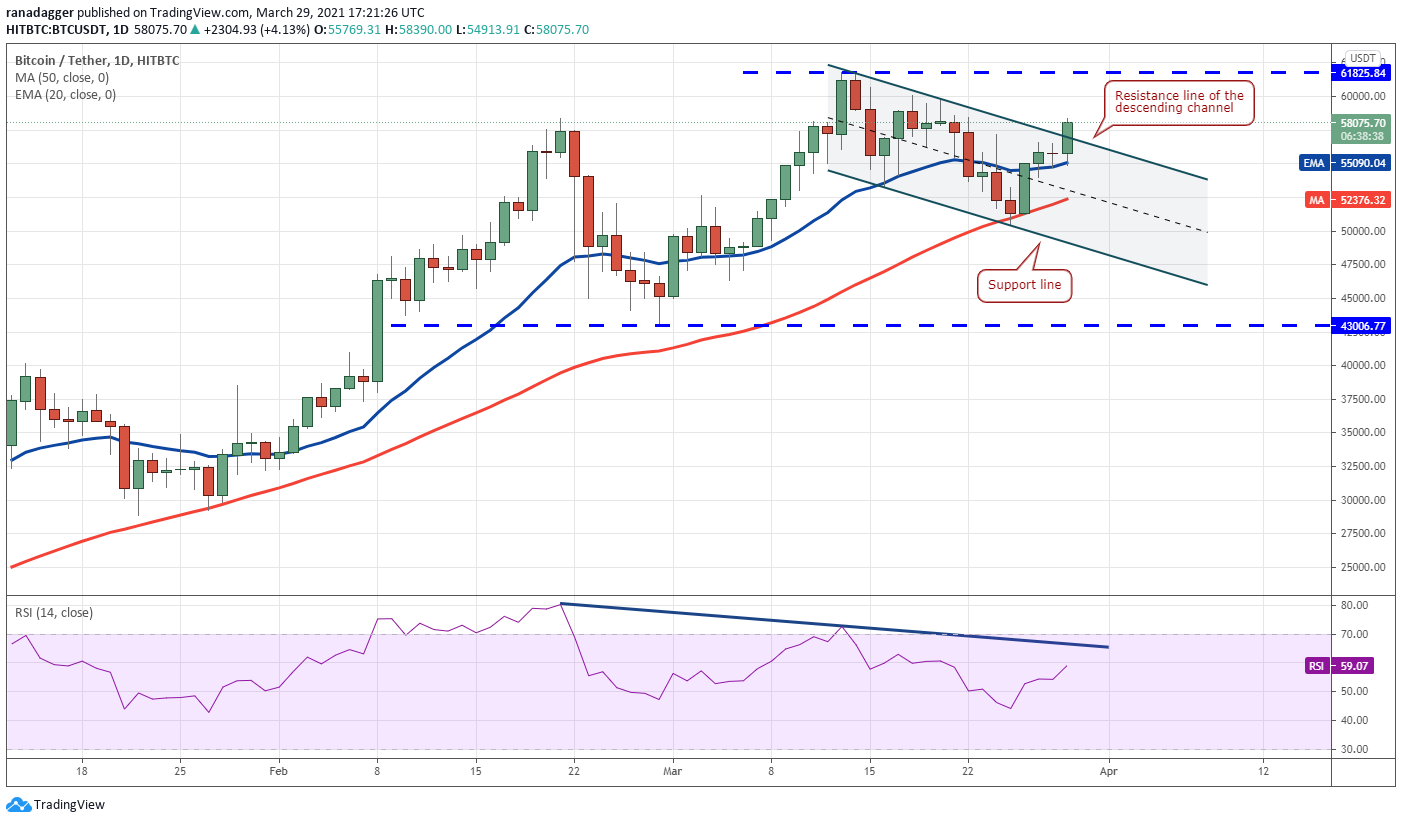
The 20-day exponential moving average ($55,090) has started to turn up and the relative strength index (RSI) has risen above 59, indicating the bulls have the upper hand. A breakout and close above $61,825.84 could open the doors for a rally to $69,279 and then $79,566.
However, the bears are unlikely to give up easily. They are likely to pose a stiff challenge at $61,825.84. If the BTC/USD pair turns down from this level but stays above the 20-day EMA, it will suggest the sentiment remains bullish as traders are buying the dips.
A break below the 50-day simple moving average ($52,376) will be the first sign that bears are making a comeback.
ETH/USDT
Ether (ETH) continues to trade inside the symmetrical triangle, which usually acts as a continuation pattern. The bulls have pushed the price above the moving averages today, indicating strong buying at lower levels.
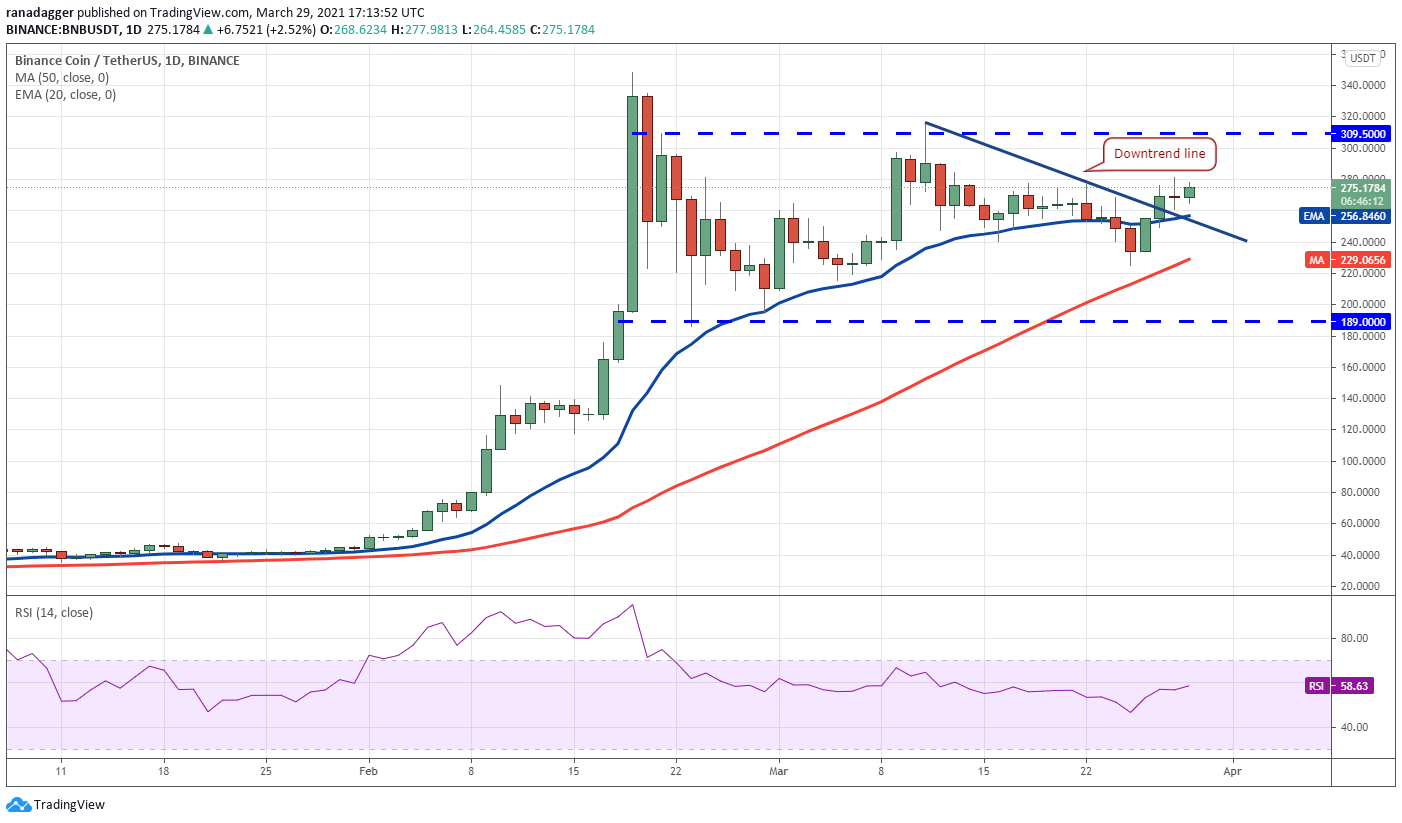
There is a minor resistance at $280 but the bulls are likely to push the price above it. If they do that, the BNB/USD pair could rise to $309.50 where the bears may mount a stiff resistance. If the price turns down from this resistance, the pair may spend a few more days in consolidation.
Conversely, if the bulls can thrust the price above $309.50, a retest of the all-time high at $348.69 is possible. A breakout of this resistance will suggest the resumption of the uptrend, which has a target objective at $430.
ADA/USDT
Cardano (ADA) continues to consolidate in the $1.03 to $1.48 range. The bulls have been sustaining the price above the 20-day EMA ($1.15) for the past three days, which is a positive sign.
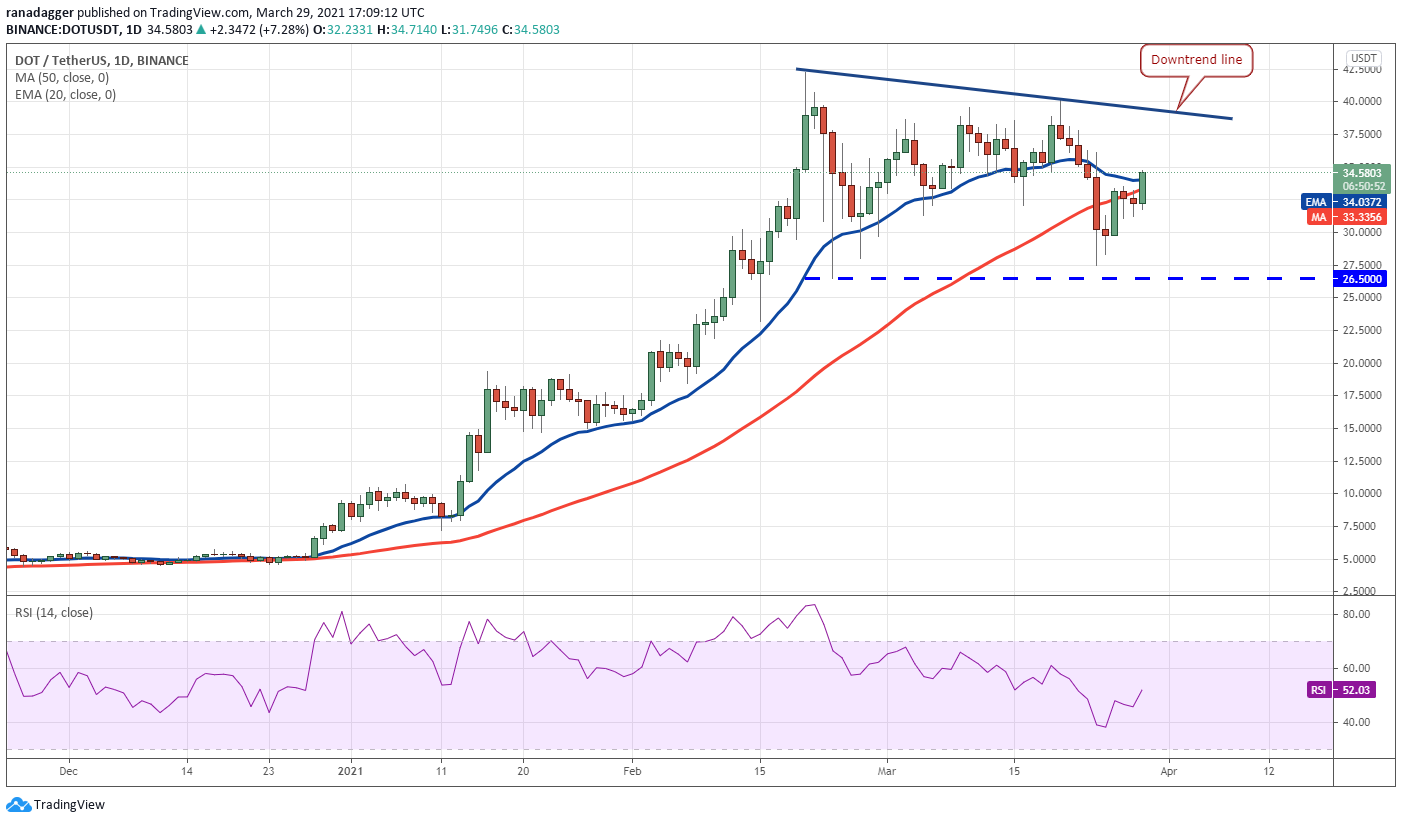
If the bulls can drive the price above the downtrend line, the DOT/USD pair may retest the all-time high at $42.28. A breakout of this resistance could open the doors for a rally to $53.50.
On the other hand, if the price turns down from the downtrend line, the pair could remain stuck inside the $26.50 to $40 range for a few more days. A break and close below $26.50 could start a deeper correction.
XRP/USDT
XRP formed an inside day candlestick pattern on March 27 and a Doji candlestick formation on March 28, both indicating indecision among the bulls and the bears. Today, the bulls are trying to resolve the uncertainty in their favor.
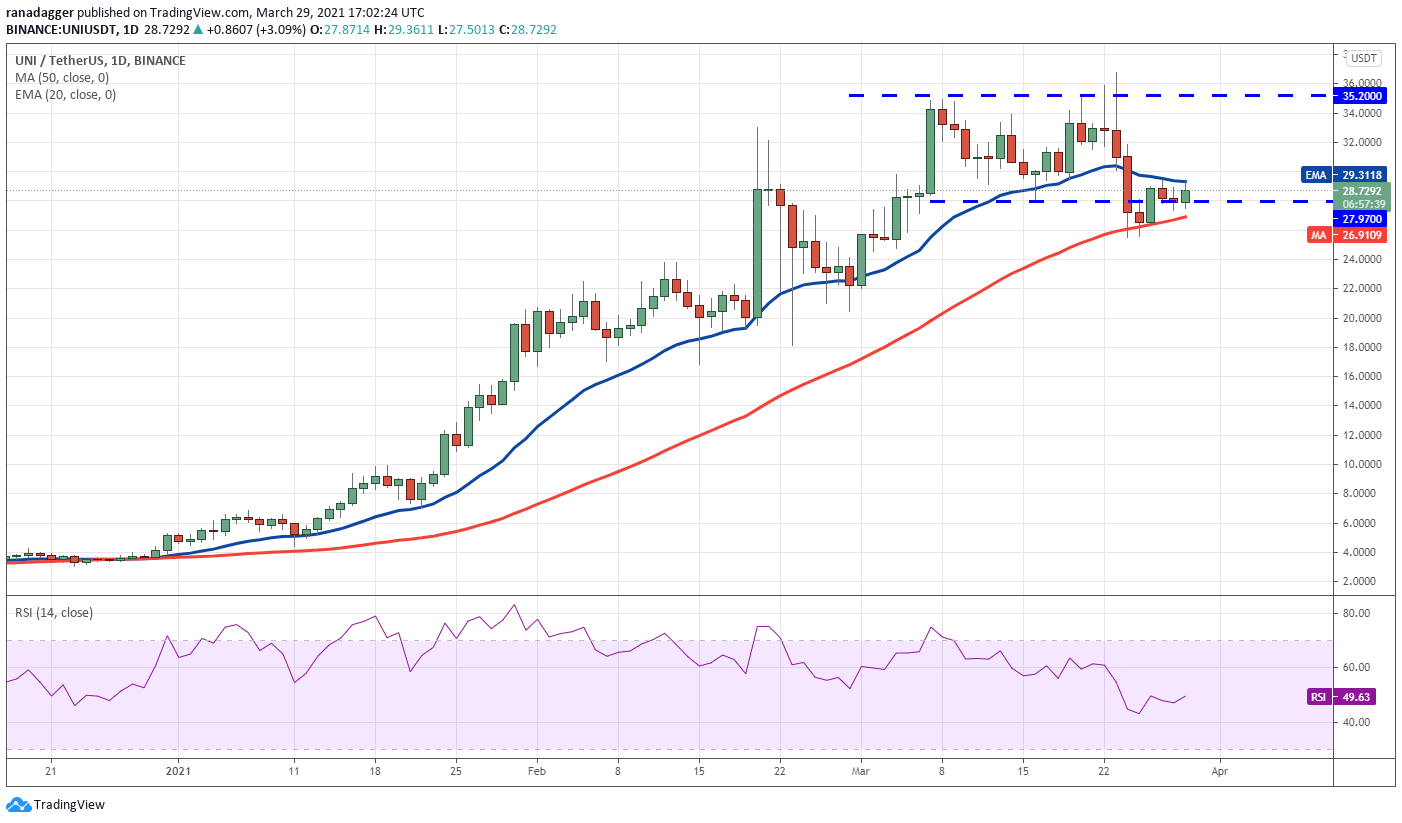
If the buyers can sustain the price above the 20-day EMA, it will suggest the recent break below $27.97 on March 24 was a bear trap. The UNI/USD pair could then gradually move up to the overhead resistance at $35.20.
A breakout of the $35.20 to $36.80 overhead resistance zone could start the next leg of the uptrend. Alternatively, a break below $25.52 may indicate the start of a deeper correction. Until then, volatile range-bound trading is likely to continue.
THETA/USDT
THETA is consolidating between $14.96 and 10.35. In an uptrend, when the correction stalls at the 38.2% Fibonacci retracement level, it shows that traders are not rushing to the exit but are buying on dips.
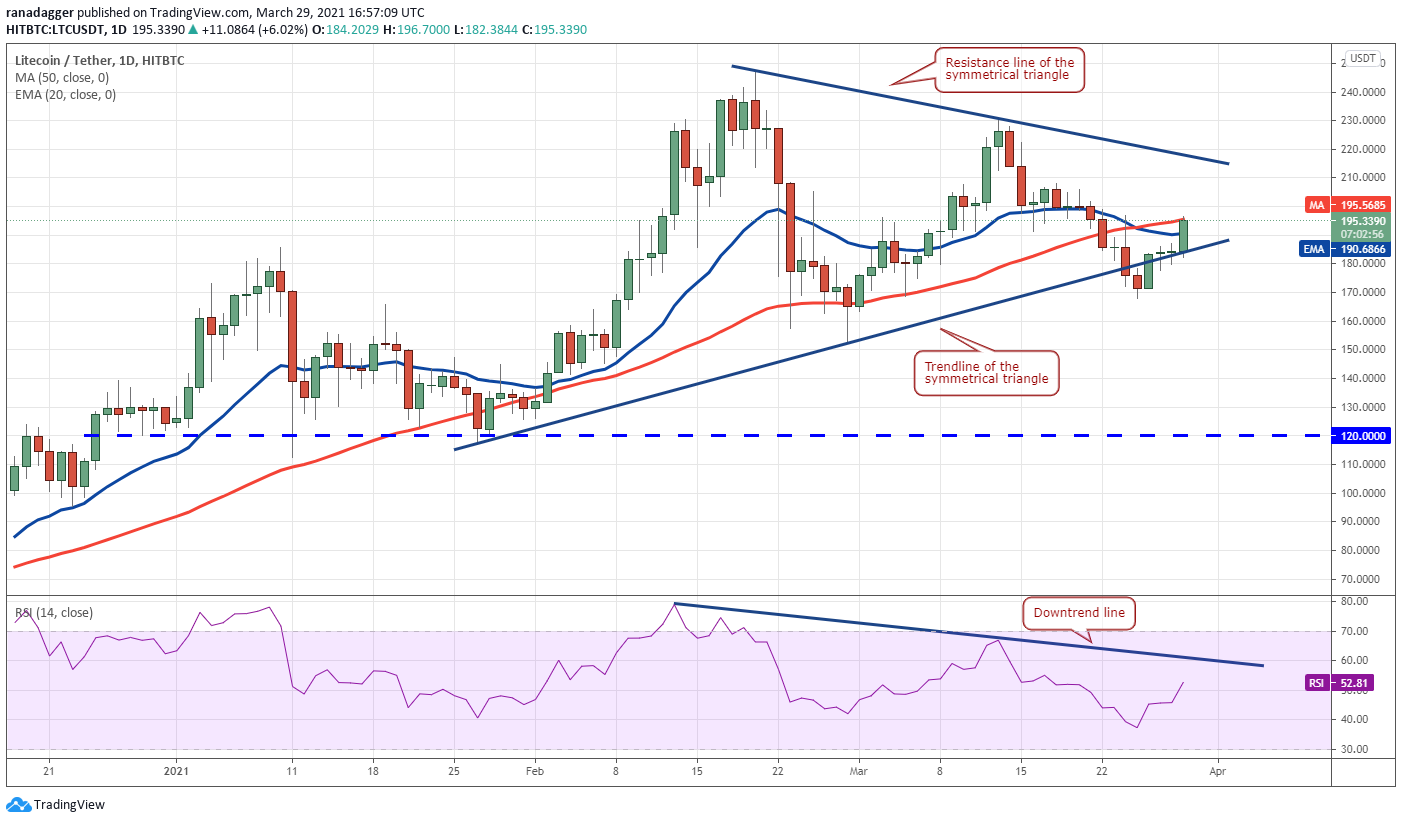
After defending the trendline of the triangle on March 27 and 28, the bulls have pushed the price above the 20-day EMA ($190.68) today. The price could now move up to the resistance line of the triangle where the bulls are likely to face stiff resistance from the bears.
If the price turns down from the resistance line, the LTC/USD pair could extend its stay inside the triangle for a few more days.
However, if the bulls drive the price above the triangle, the pair may rally to $246.96 and then to the pattern target at $309. This bullish view will invalidate if the price turns down and plummets below $168.
LINK/USDT
Chainlink (LINK) remains stuck in a range between $24 and $32. The rebound off the support of the range has reached the 50-day SMA ($29) where the bears may offer some resistance.
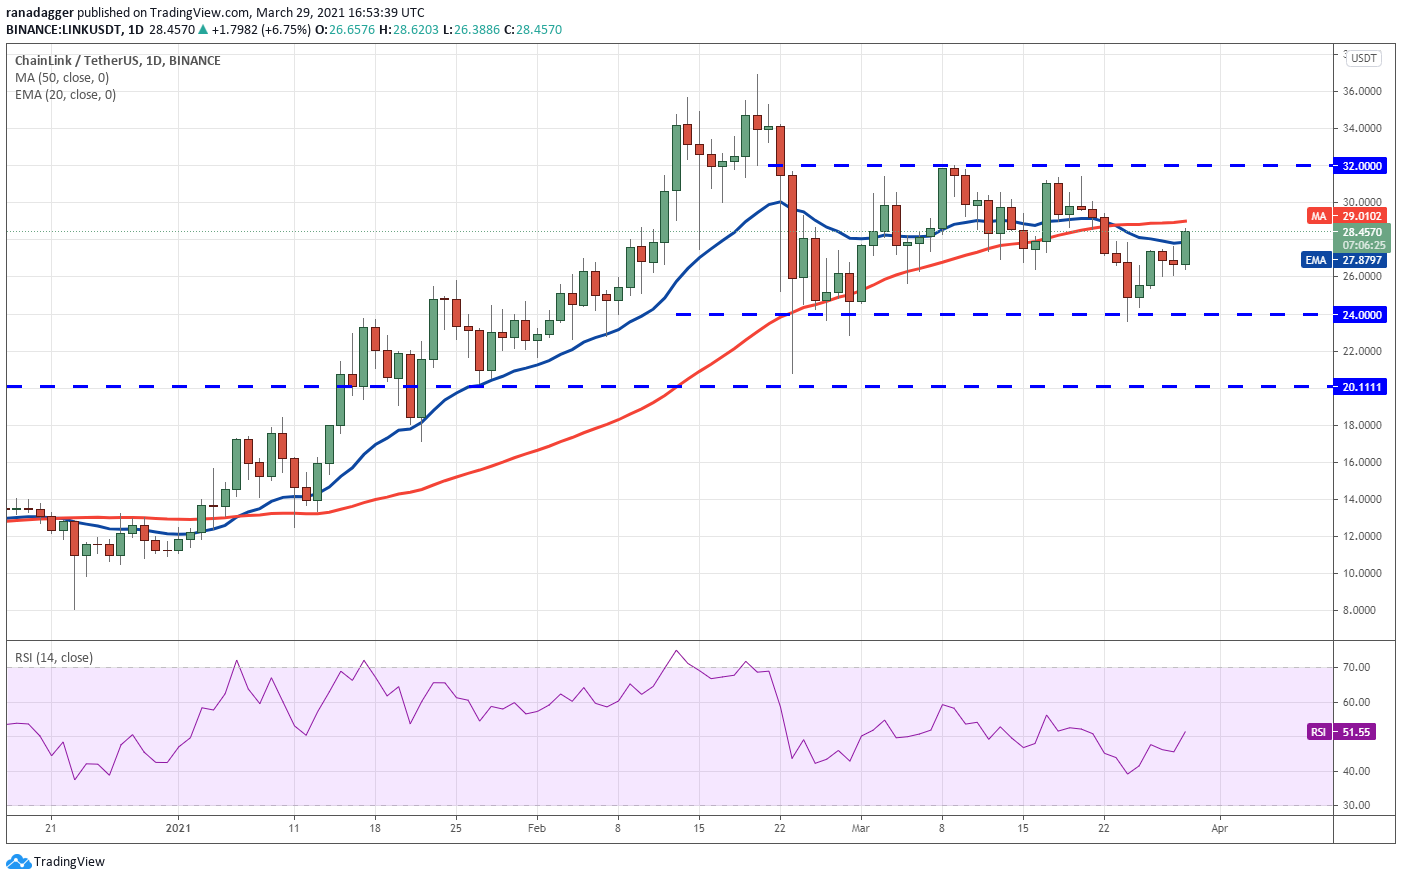
The flat moving averages and the RSI just above the midpoint do not project a clear advantage either to the bulls or the bears. The indicators suggest the continuation of the range-bound action for a few more days.
If the LINK/USD pair turns down from the 50-day SMA, the bears will make another attempt to sink the price below $24. If they succeed, the pair may drop to $20.11 and then to $18.
On the other hand, if the bulls can drive the price above the moving averages, the pair may rally to $32. A break above this level will increase the possibility of the resumption of the uptrend.
The views and opinions expressed here are solely those of the author and do not necessarily reflect the views of Cointelegraph. Every investment and trading move involves risk. You should conduct your own research when making a decision.
Market data is provided by HitBTC exchange.