XRP (XRP) has been struggling to break out above the $0.60 area since May 2018.
Despite the failed attempts, XRP is expected to be successful in breaking out soon. A breakout above the current descending resistance line would confirm that the upward movement has begun.
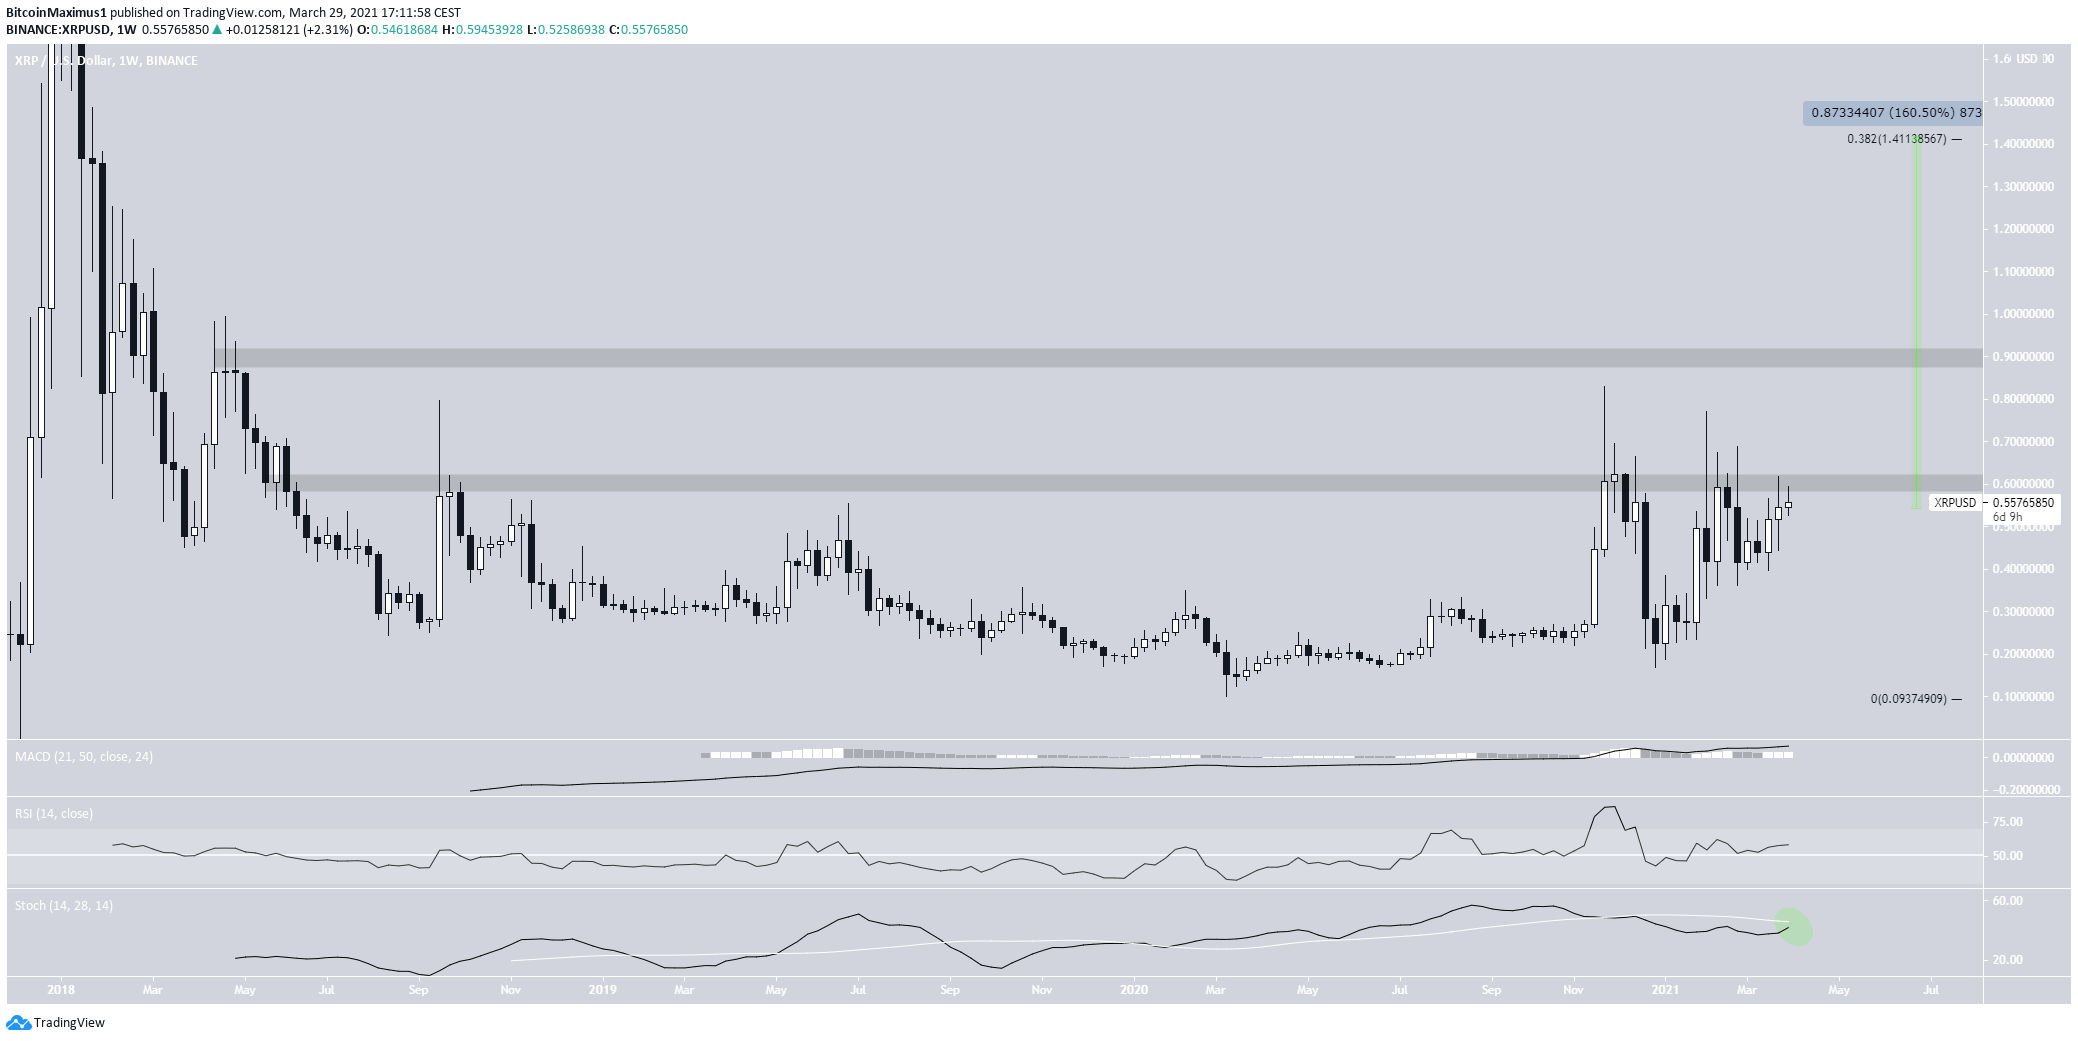
Long-Term Levels
The token is currently trading just below the $0.60 resistance area. It has not reached a weekly close above this level since May 2018.
However, technical indicators are bullish. Both the RSI & MACD are increasing, the former being above 50 while the latter being positive. The stochastic oscillator has yet to make a bullish cross but is very close to doing so.
If the token’s price breaks out, the next resistance area would be found at $0.90.
Also, it is interesting to note that the token is still far away from the closest Fib retracement level when measuring from the all-time high. The 0.382 Fib retracement level is found at $1.41, being 160% above the current price.
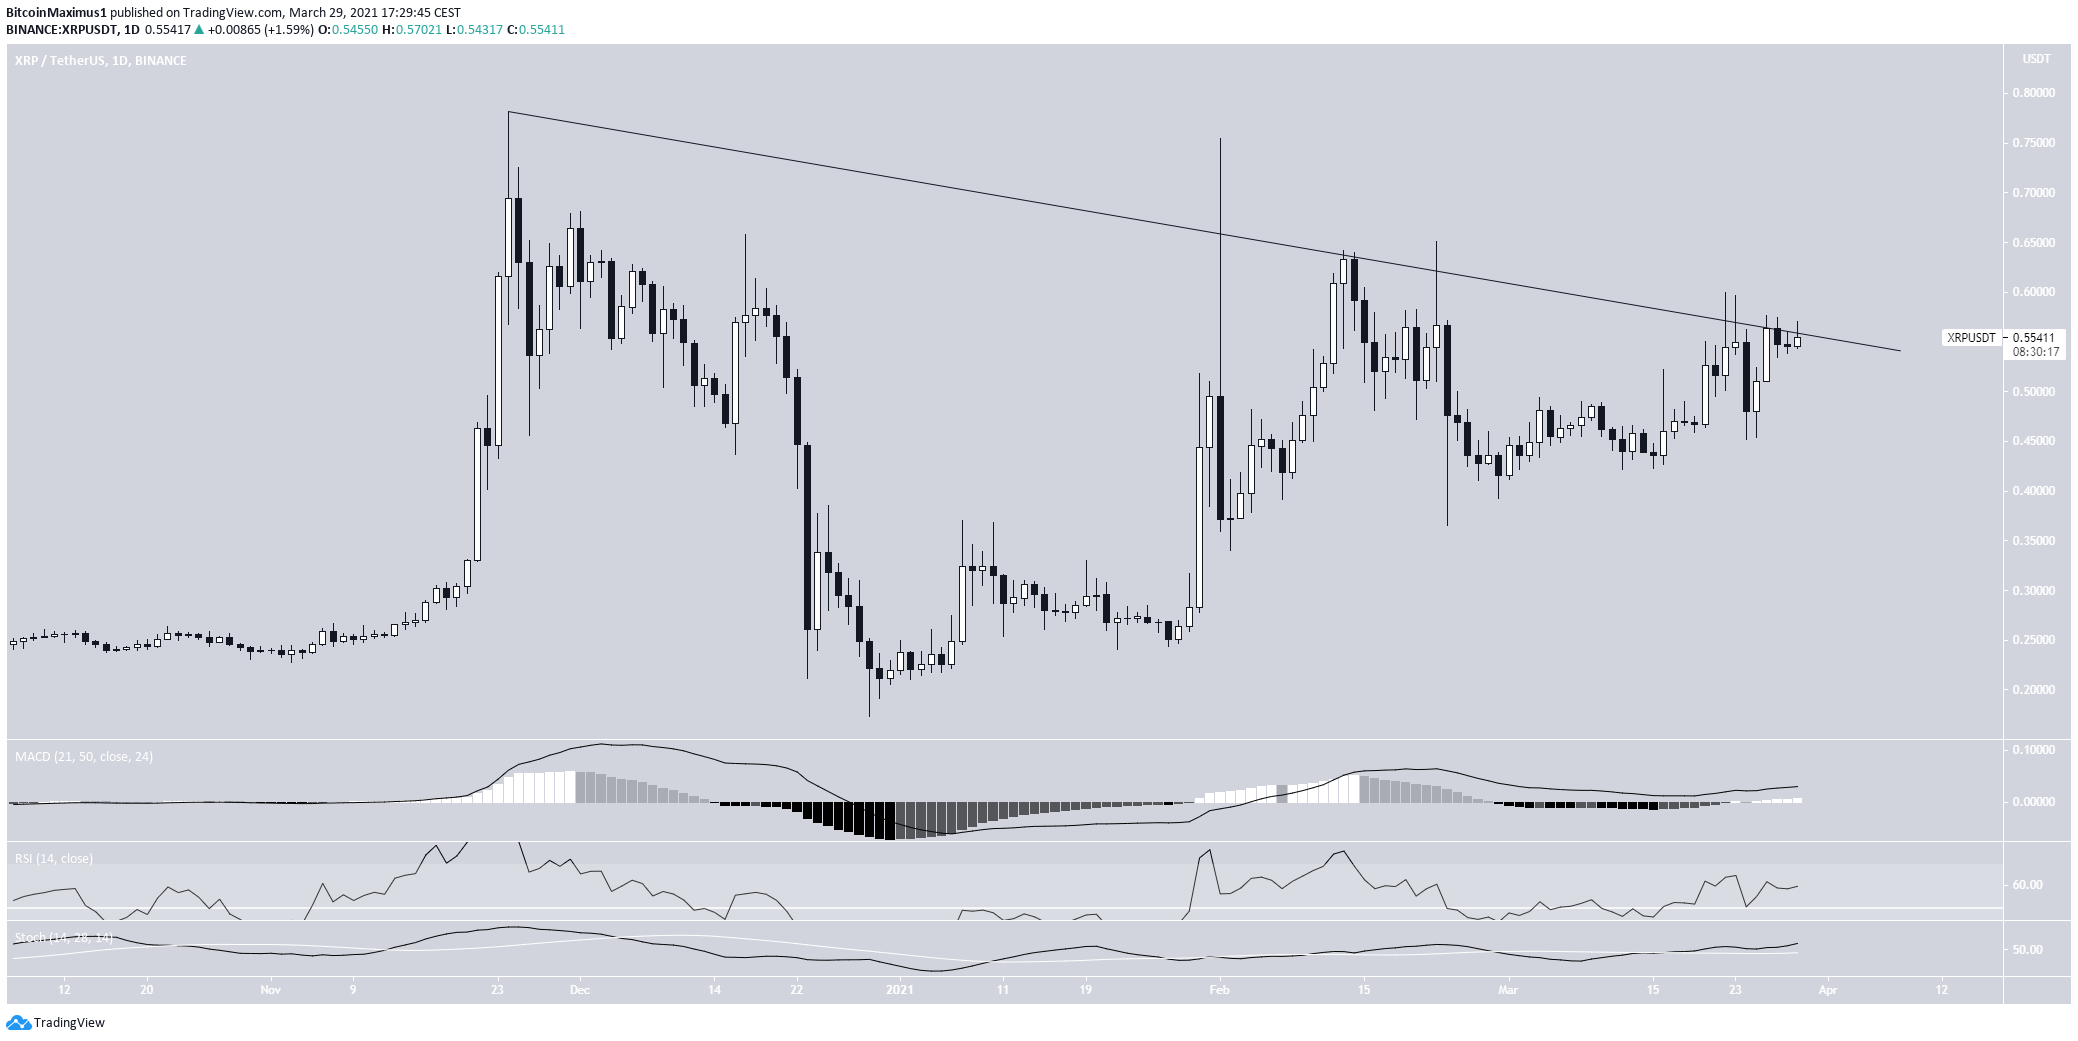
Will XRP Break Out?
The daily chart shows that XRP has been following a descending resistance line since Nov. 24, 2020. Also, it has been moving upwards since bouncing on Feb. 23.
Similar to the weekly time-frame, technical indicators are bullish, with even the Stochastic oscillator has made a bullish cross.
This indicates that a breakout is expected. If so, it would likely take XRP above the long-term resistance area of $0.60 as outlined in the previous section.
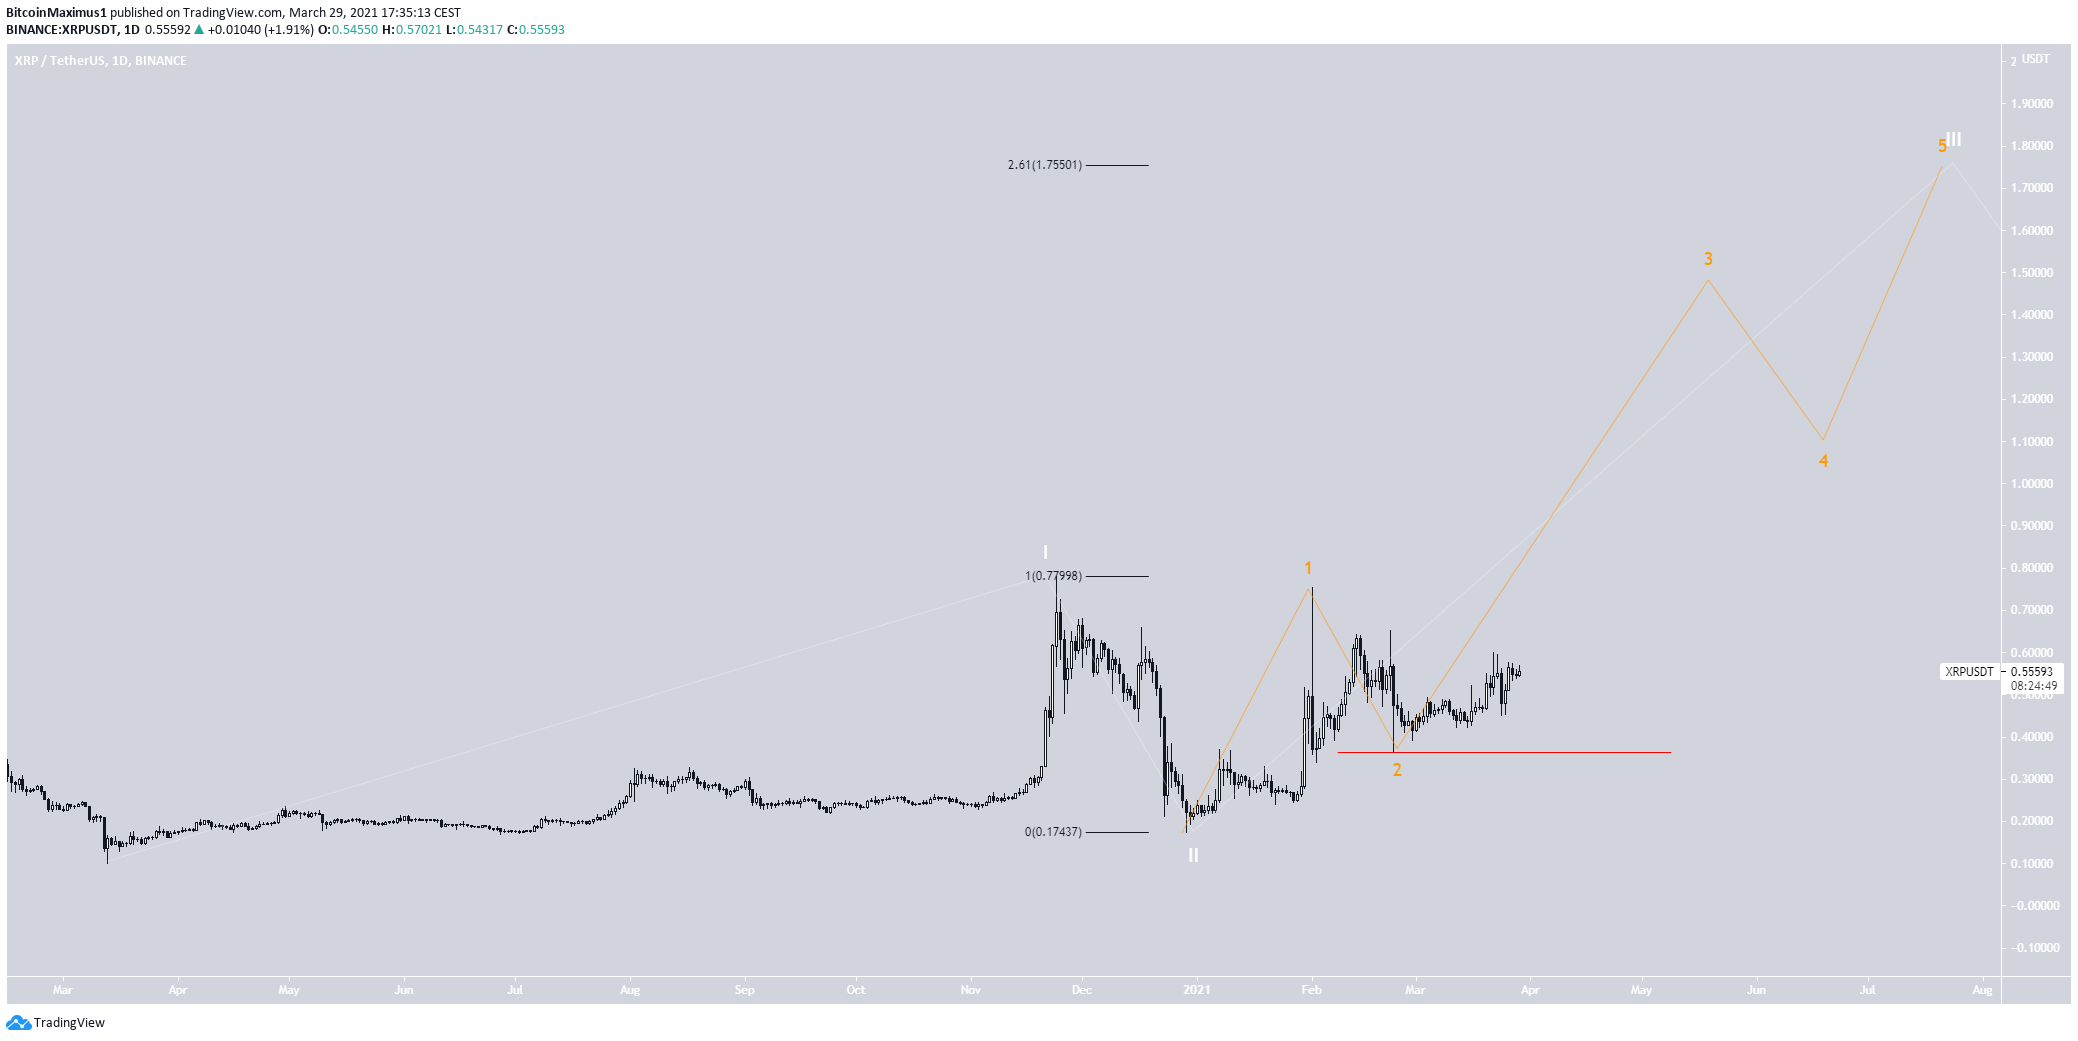
Wave Count
The long-term wave count (white) suggests that BTC has either just completed wave two or is still in it.
It seems that wave one transpired from March – December 2020, in what is potentially a leading diagonal.
However, the sub-wave count (orange) is not completely clear. The most likely scenario suggests that the token has completed sub-waves 1&2 and is now in sub-wave three.
In this case, XRP would soon break out, aligning with the readings from the daily and weekly time-frame.
A potential target for the top of the entire wave three would be found at $1.75, with the previously outlined $0.90 and $1.34 resistance levels acting as intermediate targets.
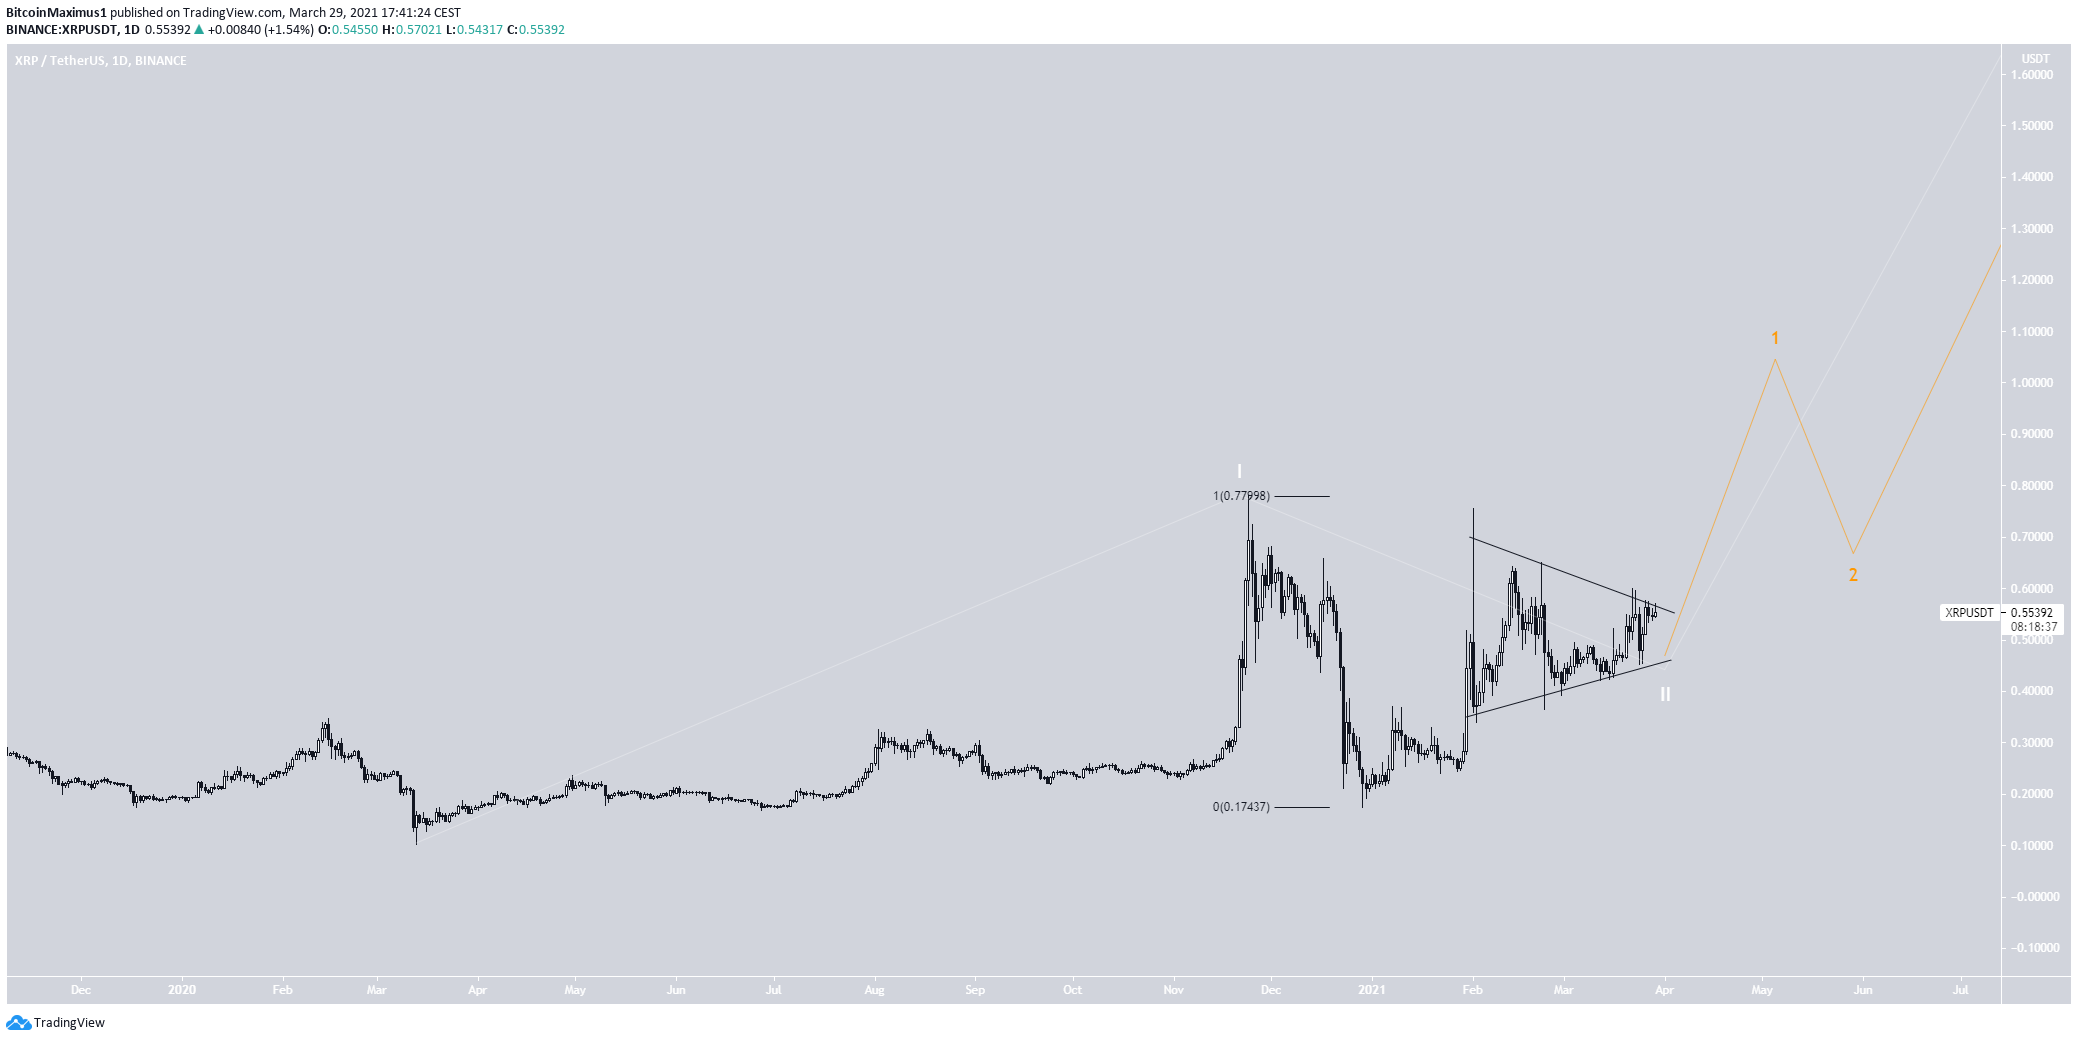
The alternative count suggests that the token is still in wave two (white), a complex correction.
In any case, the result would be the same, with the only exception being that the breakout would likely be more gradual due to XRP being in sub-wave one (orange).
XRP/BTC
Cryptocurrency trader @Cryptoes_ outlined an XRP/BTC chart, stating that a reclaim of the current level could lead to a significant upward movement, such as that which transpired in 2017.
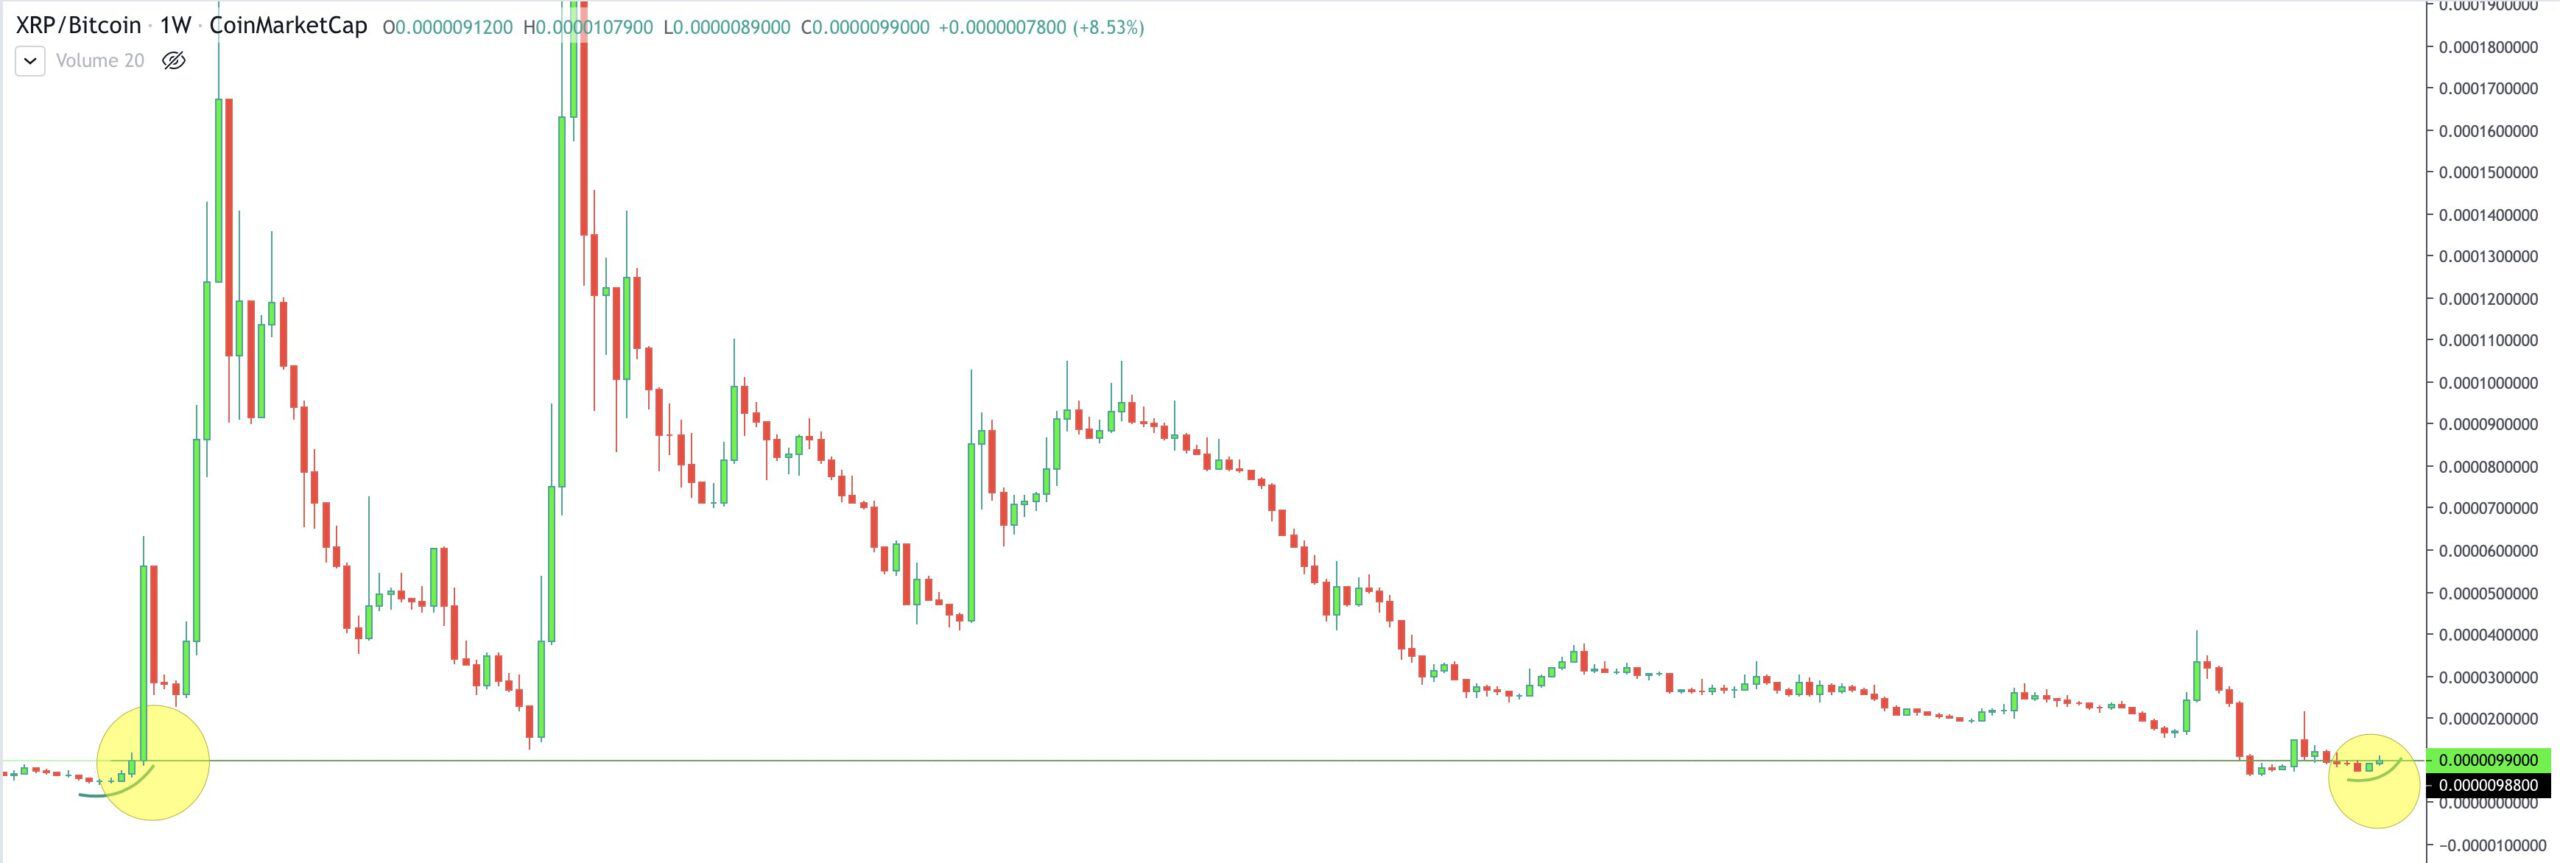
The aforementioned resistance level is found at 1600 satoshis.
While some bullish reversal signs, most notably the bullish reversal in the MACD, the trend cannot be considered bullish until the token reclaims this level.
If so, the next resistance area would be found at 3600 satoshis.
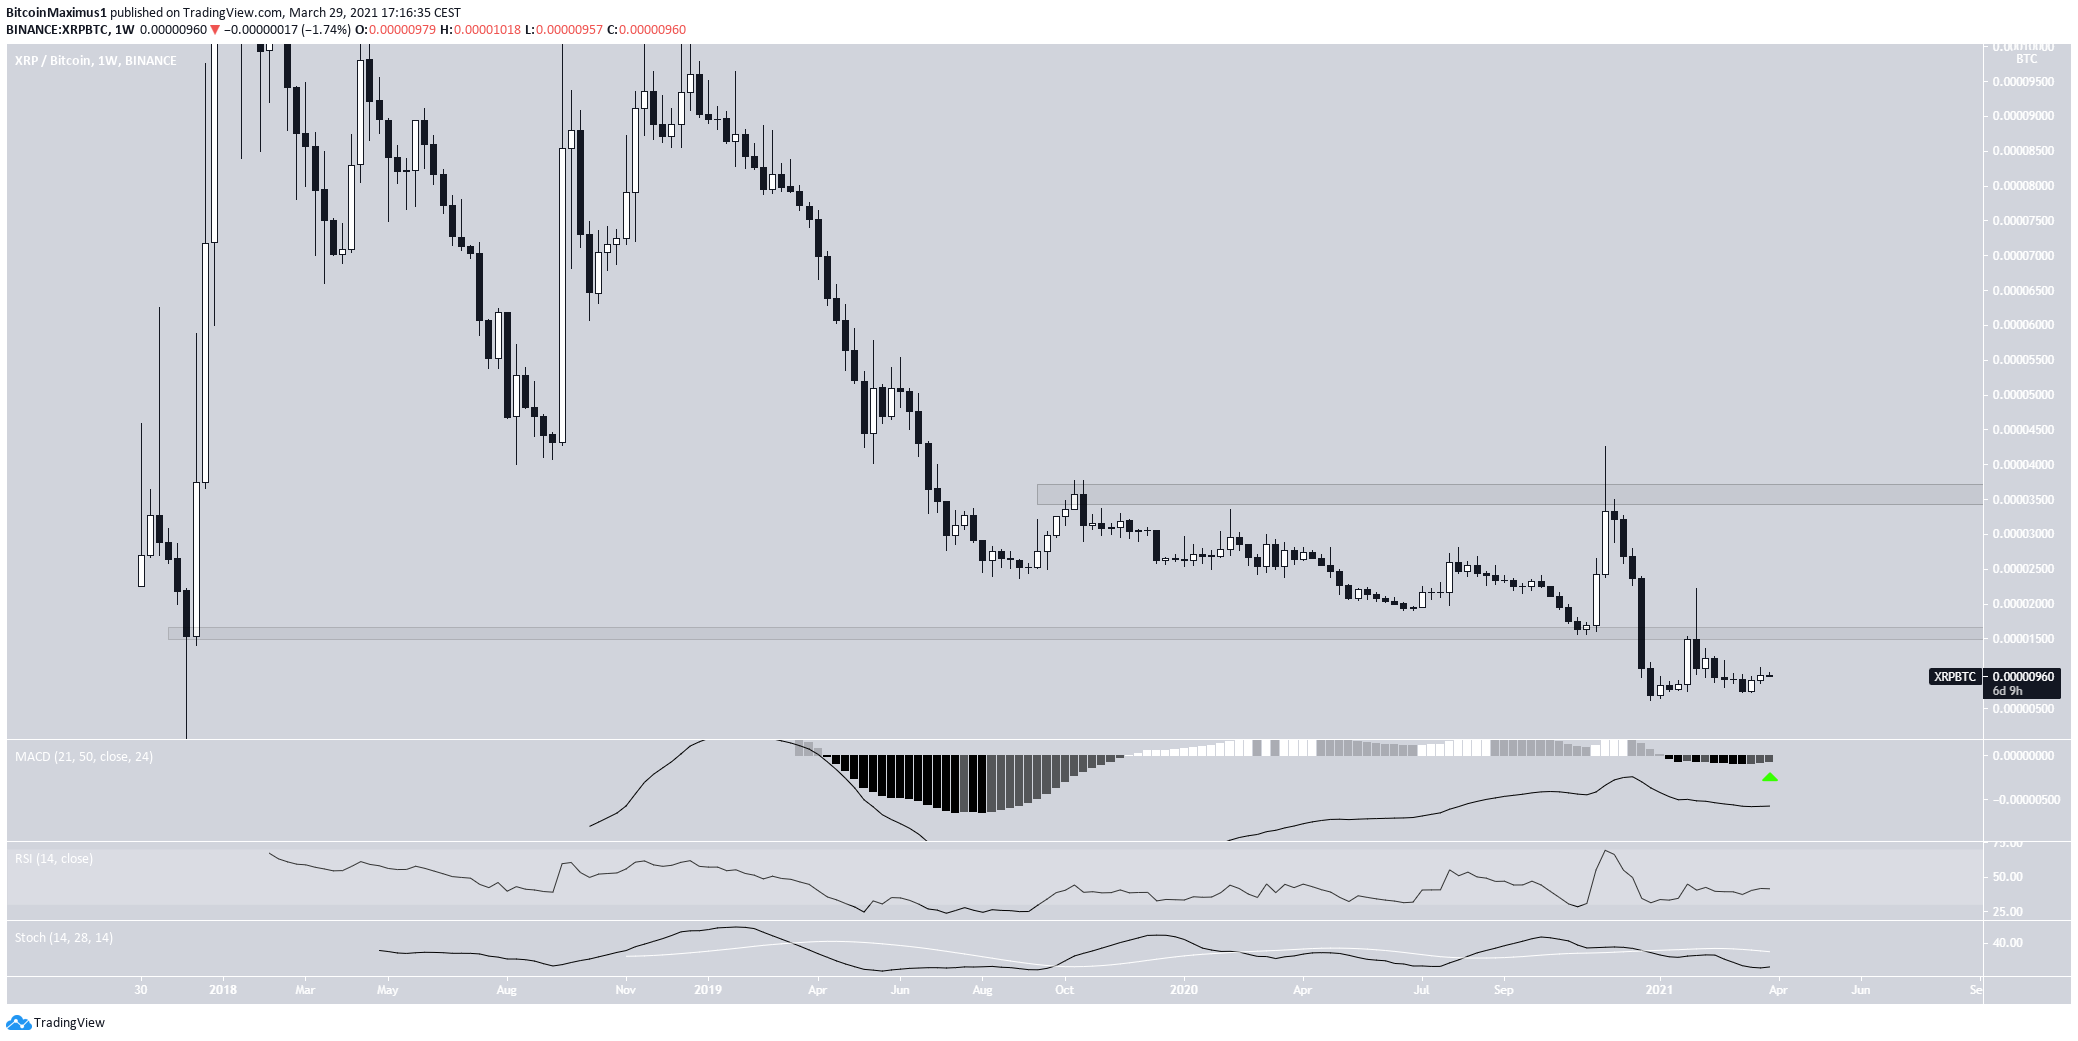
Conclusion
While XRP/BTC shows bullish reversal signs, we cannot consider the trend bullish until the 1600 satoshi area is reclaimed.