The TomoChain (TOMO) price has been increasing since retesting the previous all-time high resistance area of $1.50.
While the direction of the short-term trend for TomoChain is not completely clear, the long-term trend appears bullish.
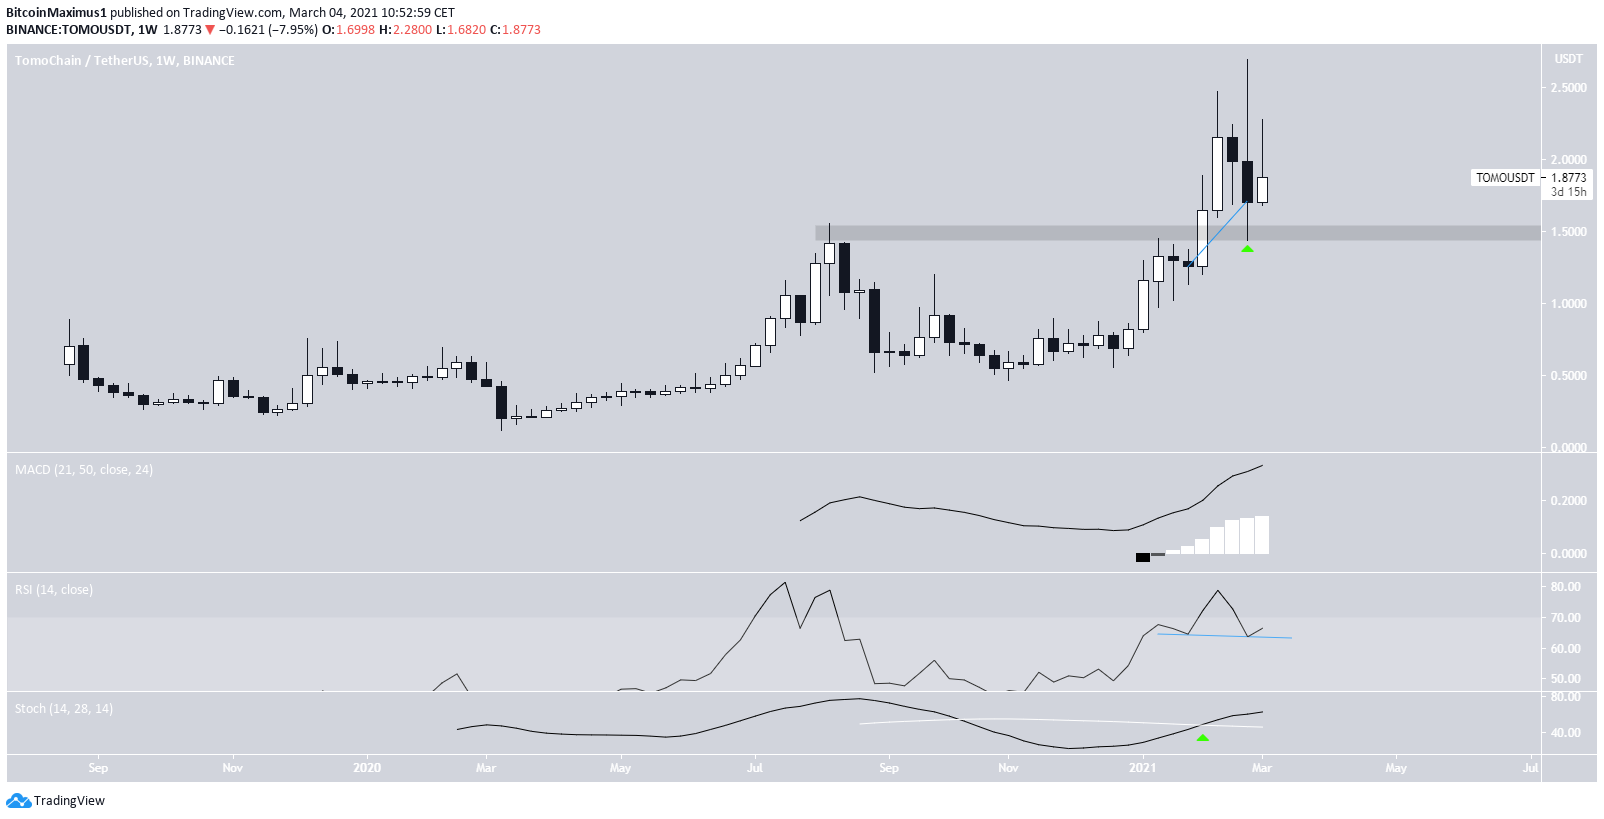
TomoChain Long-Term Retest
TOMO has been decreasing since Feb. 24, when it reached an all-time high price of $2.69.
The decrease took it to a low of $1.51 just a few days later, but TOMO bounced almost immediately after.
The drop and subsequent bounce served to validate the $1.50 area as support. This was a bullish development considering that the same area had previously acted as resistance prior to the breakout.
Technical indicators are bullish. The Stochastic oscillator has made a bullish cross and is increasing. Similarly, the MACD is increasing while the RSI has generated a hidden bullish divergence.
Therefore, the long-term trend for TOMO is considered bullish.
Cryptocurrency trader @damskotrades outlined a TOMO chart, stating that it will likely increase in a very similar way to BAT. This is due to the bullish retest of the previous all-time high in both cases.
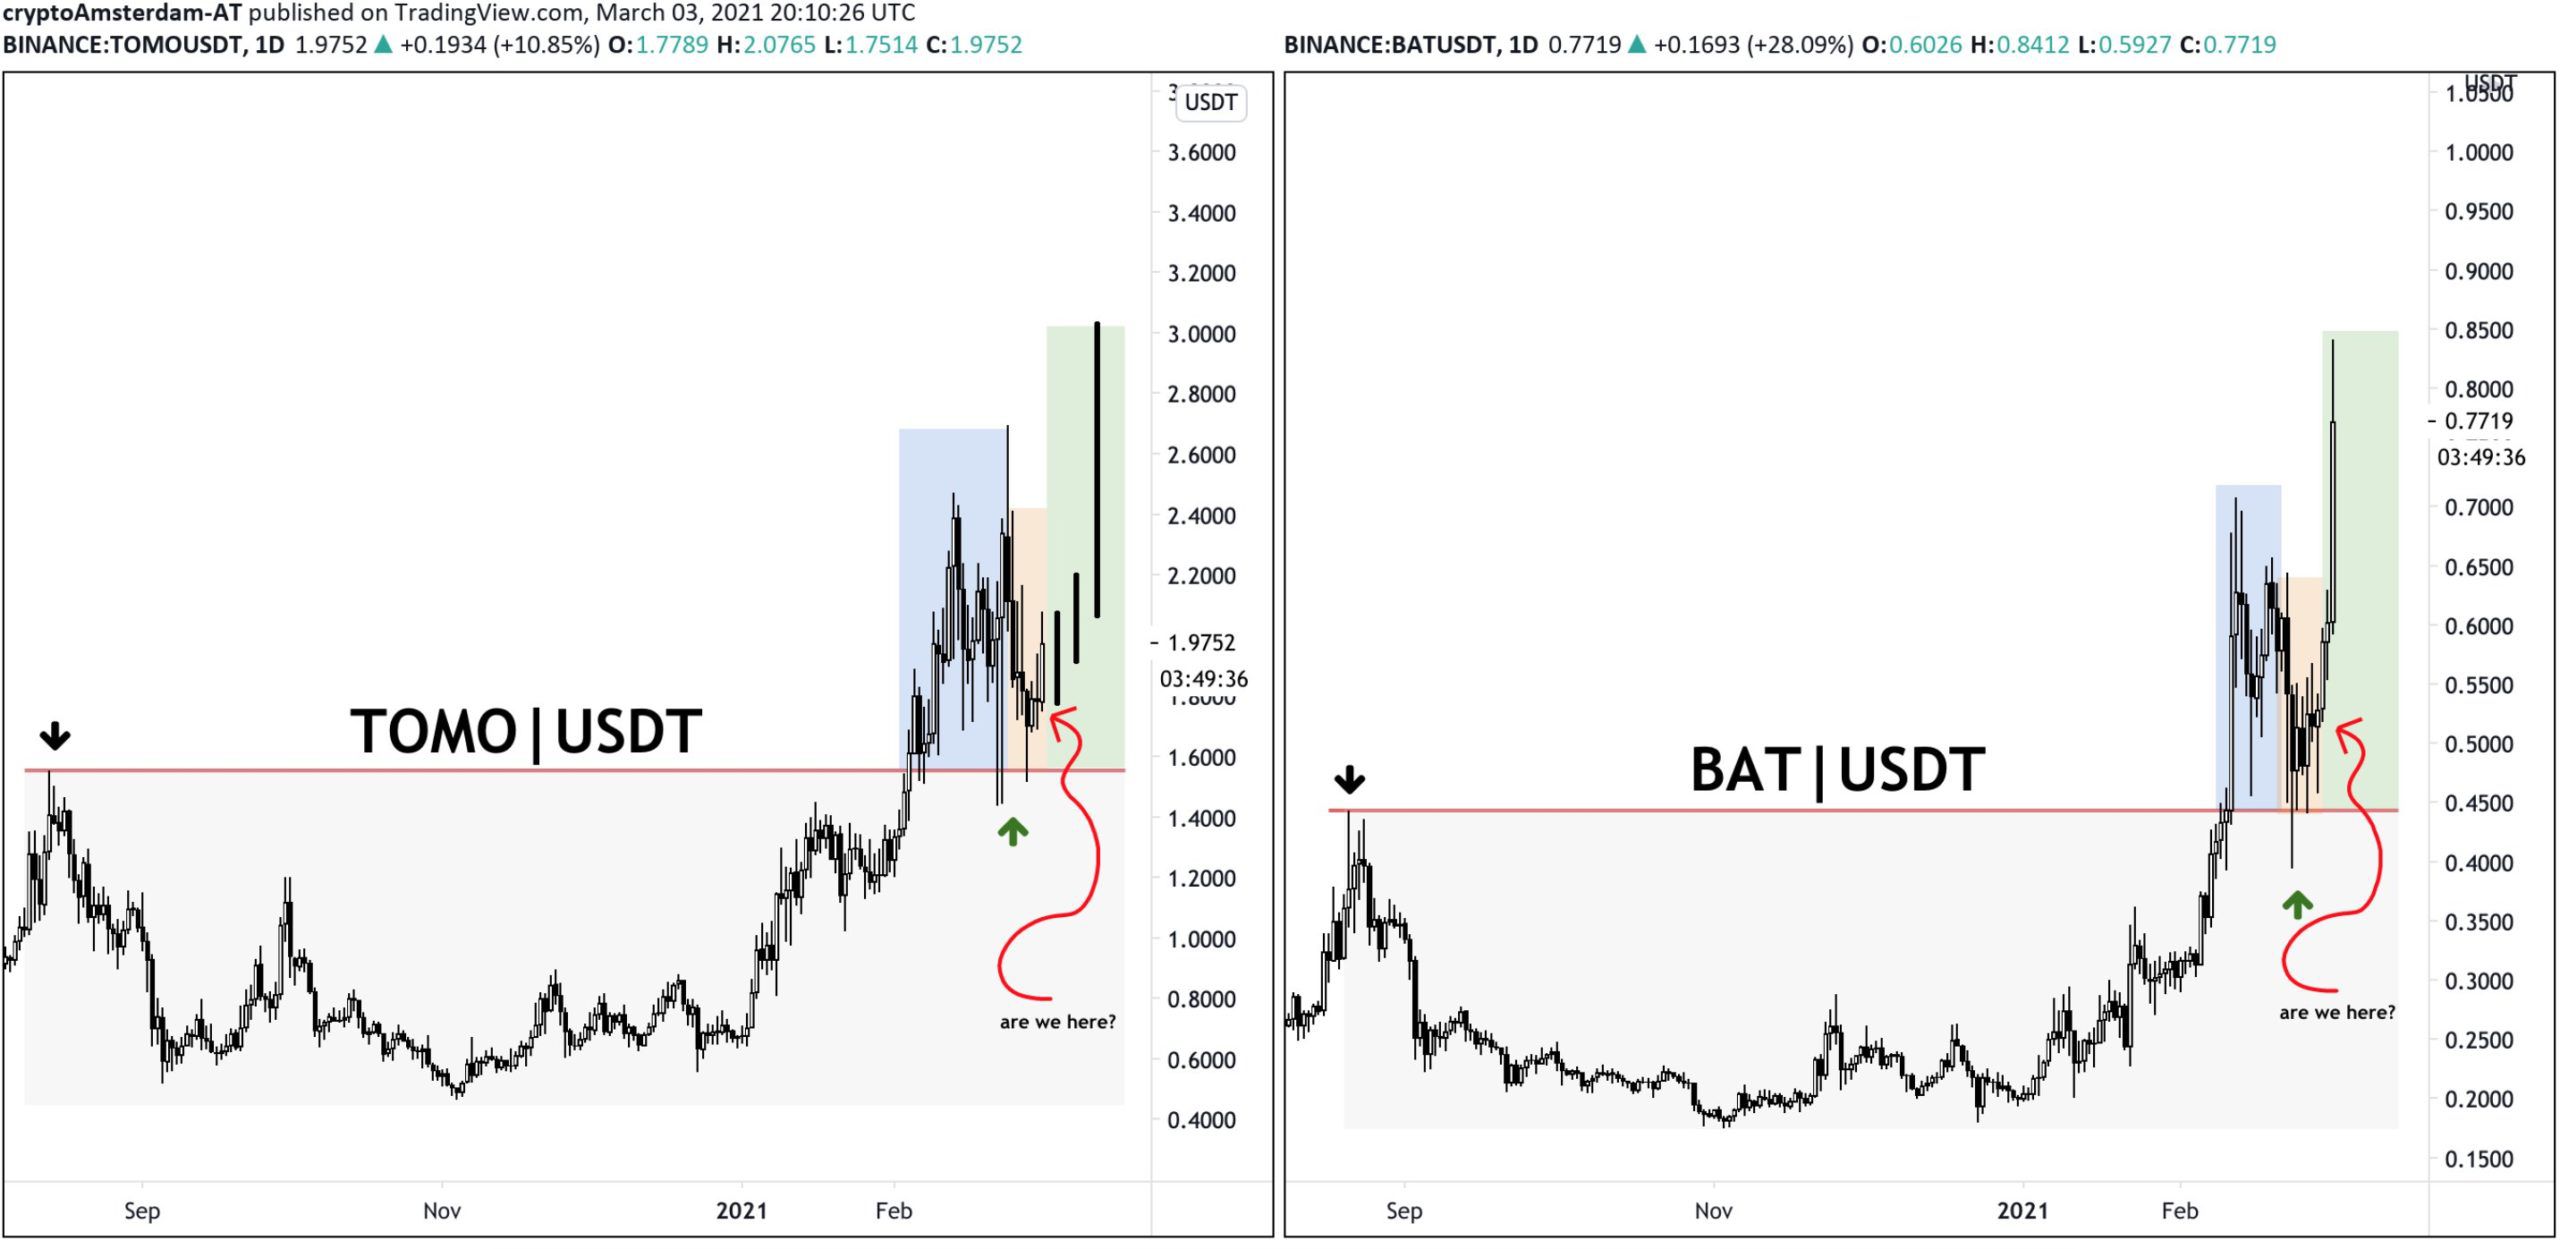
As seen above, this possibility is supported by the bullishness from technical indicators.
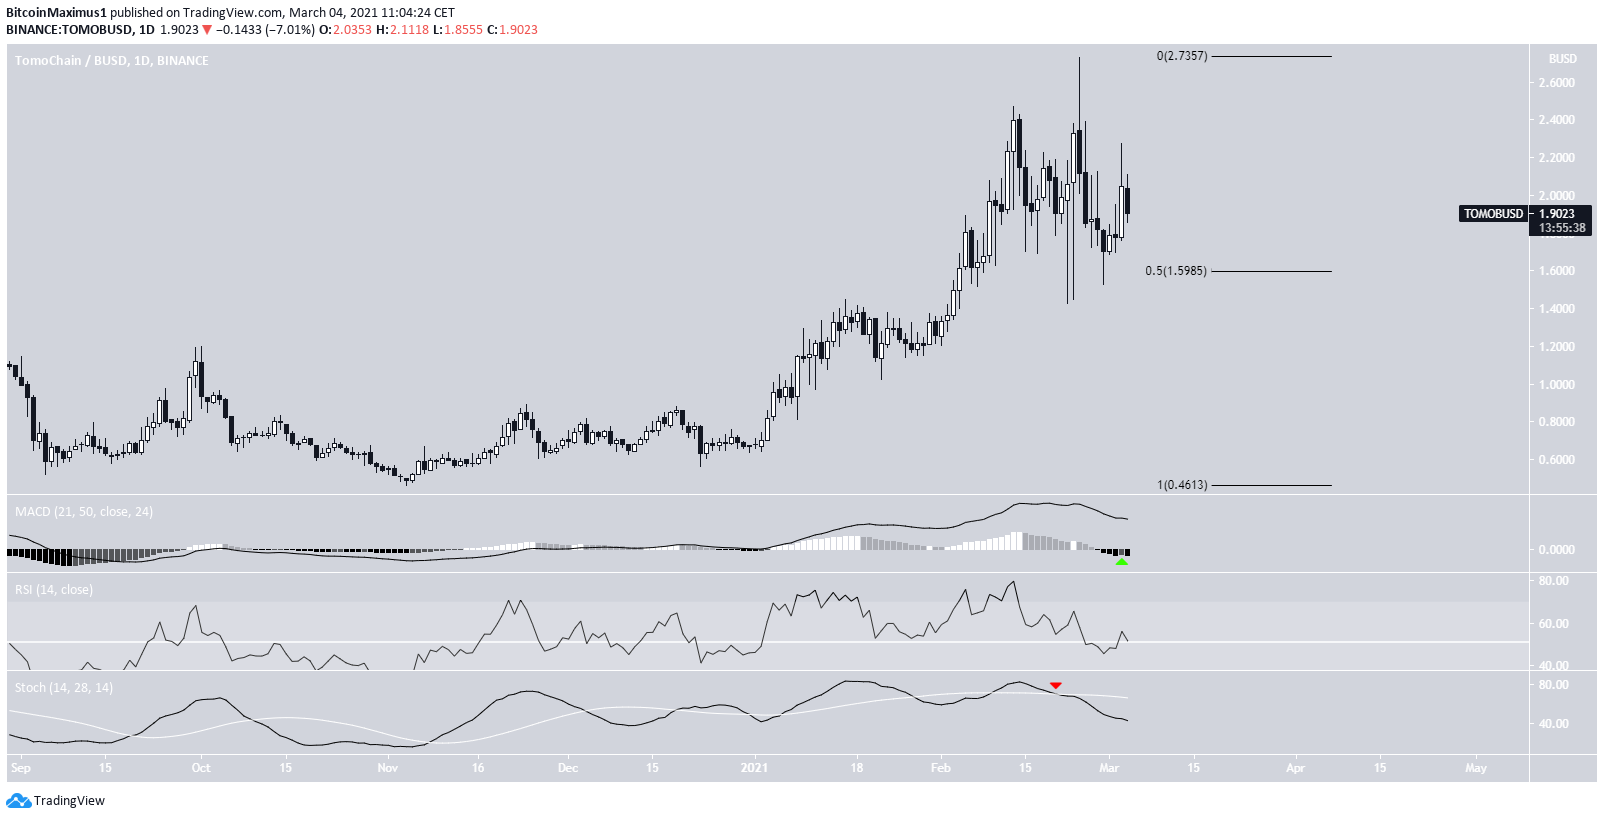
Current Movement
The daily chart shows that TOMO has also bounced at the 0.5 Fib retracement level.
Despite the bounce, technical indicators do not yet confirm the bullish trend. While the MACD is showing signs of strength by creating a higher momentum bar, the RSI and Stochastic oscillator are bearish/neutral.
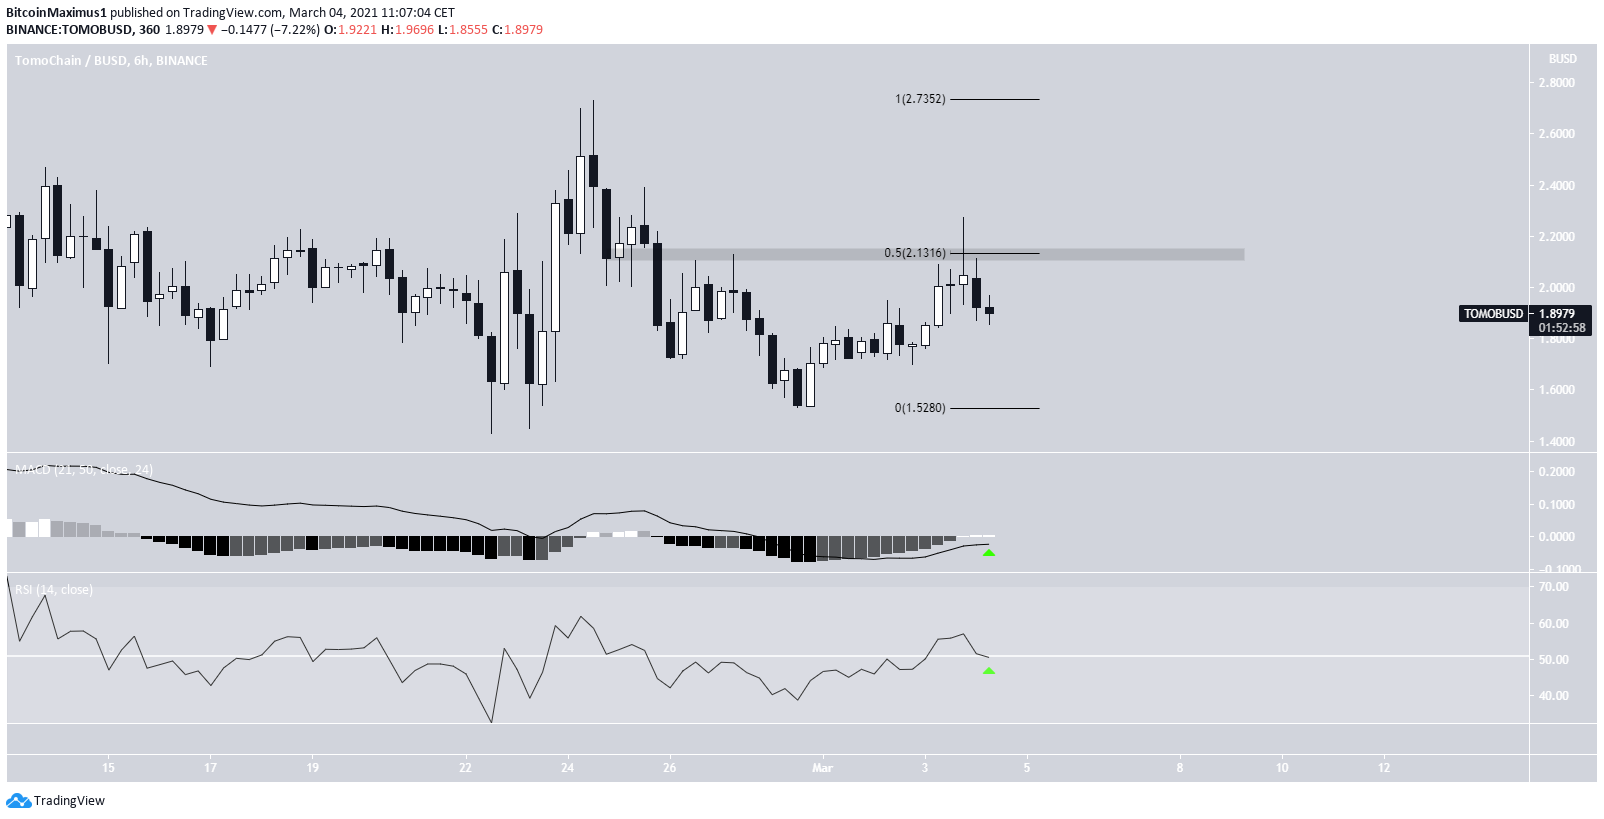
Similarly, the six-hour chart shows that TOMO has yet to clear the minor resistance area at $2.13.
Despite the bullishness from short-term indicators, we cannot consider the short-term trend bullish until this area is reclaimed.
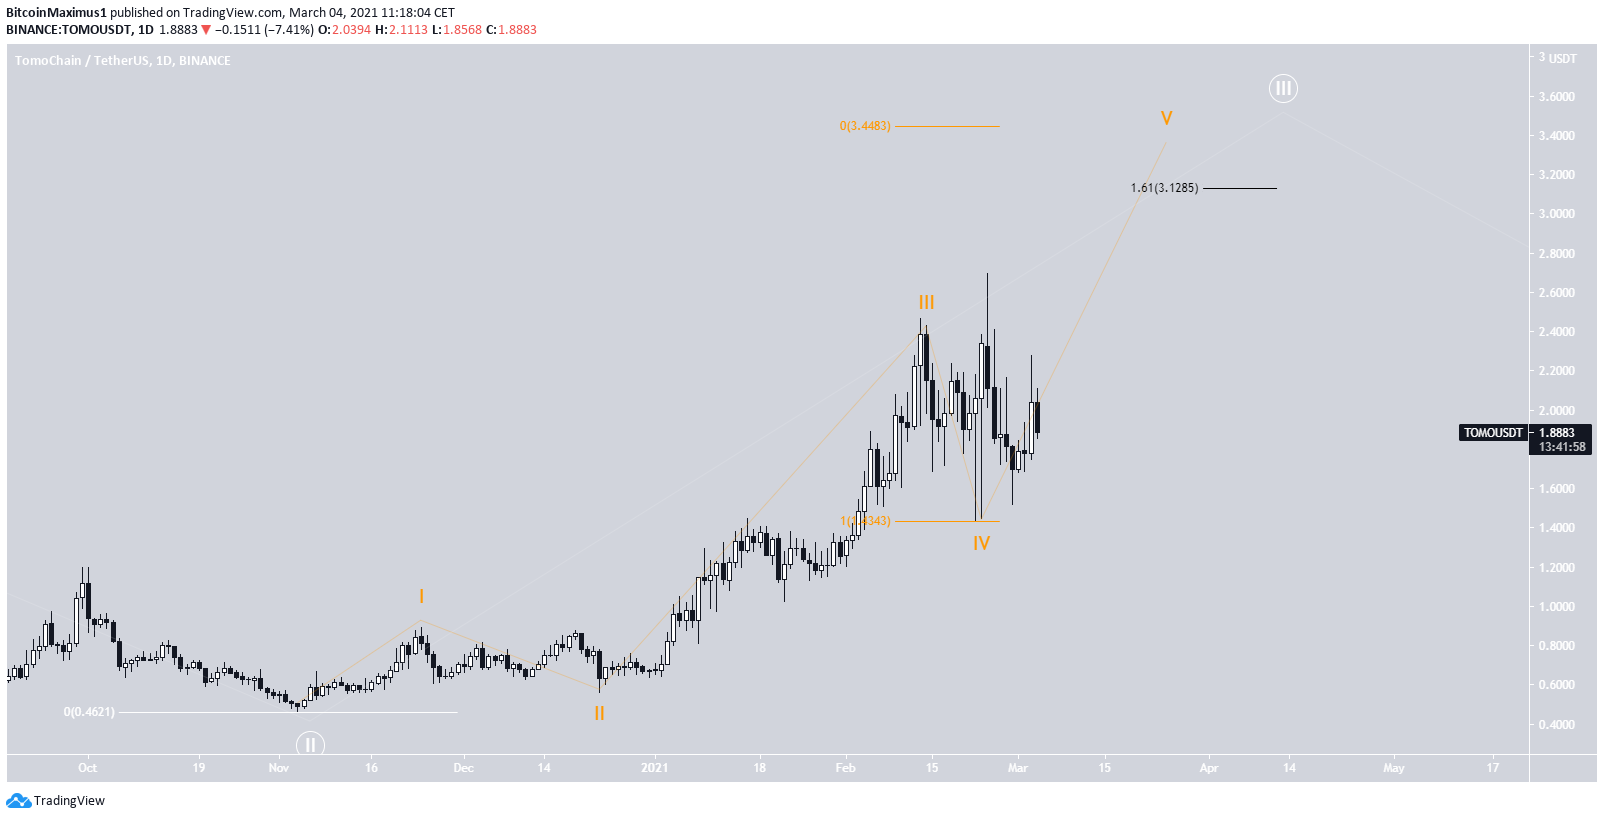
Wave Count
The wave count is not entirely clear. At the current time, there are several valid possibilities.
Nevertheless, the most likely scenario seems to be that TOMO is in wave five of a bullish impulse (orange).
A potential target for the top of the movement is located between $3.12-$3.44, aligning with the range given in the tweet.
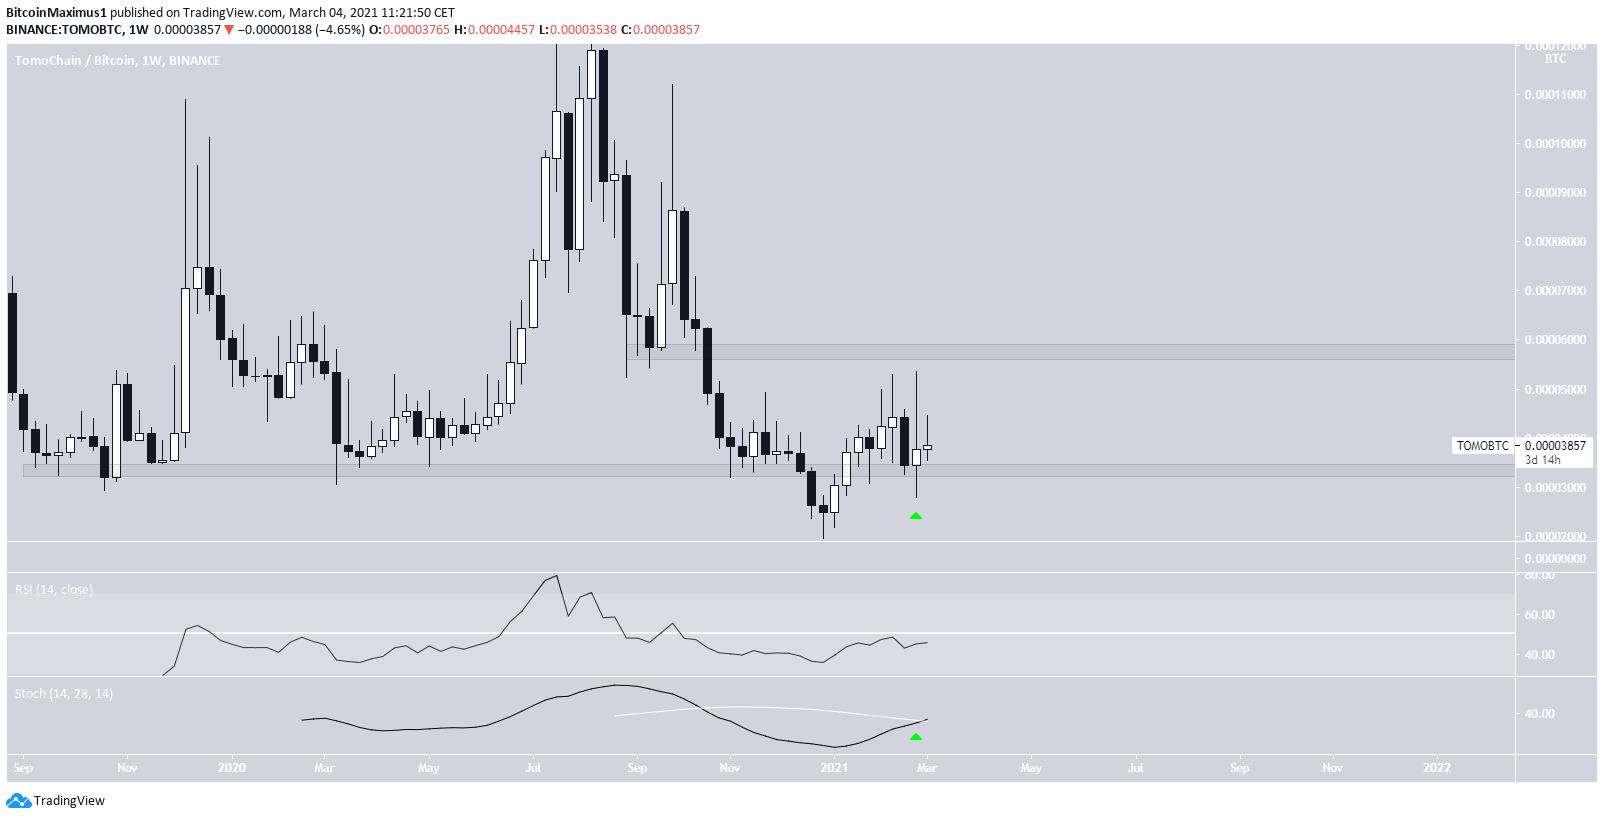
TOMO/BTC
The weekly chart for TOMO/BTC shows reclamation of the 3,350 satoshi support level. This occurred after TOMO reached an all-time low price of 1,966 satoshis.
Technical indicators are bullish, as evidenced by the bullish cross in the Stochastic oscillator.
Therefore, TOMO/BTC is expected to gradually increase towards 5,800 satoshis.
Conclusion
While the exact short-term movement is unclear, it’s likely that the long-term TomoChain trend is bullish. Therefore, a new all-time high price is expected.
Similarly, the TOMO/BTC trend is considered bullish after reclaiming the 3,350 satoshi area.