Compound is a DeFi lending protocol that allows users to earn interest on their cryptocurrencies by depositing them into one of several pools supported by the platform.
When a user deposits tokens to a Compound pool, they receive cTokens in return. These cTokens represent the individual’s stake in the pool and can be used to redeem the underlying cryptocurrency initially deposited into the pool at any time.
Past Performance of COMP
The opening price of COMP on February 16, 2021, was $460.31. As of February 22, 2021, COMP closed at $423.19. The COMP price is on a downswing. It has fallen by roughly 8% in the past week.
In the last 24 hours, the COMP price has fluctuated between $322.15 and $470.70.
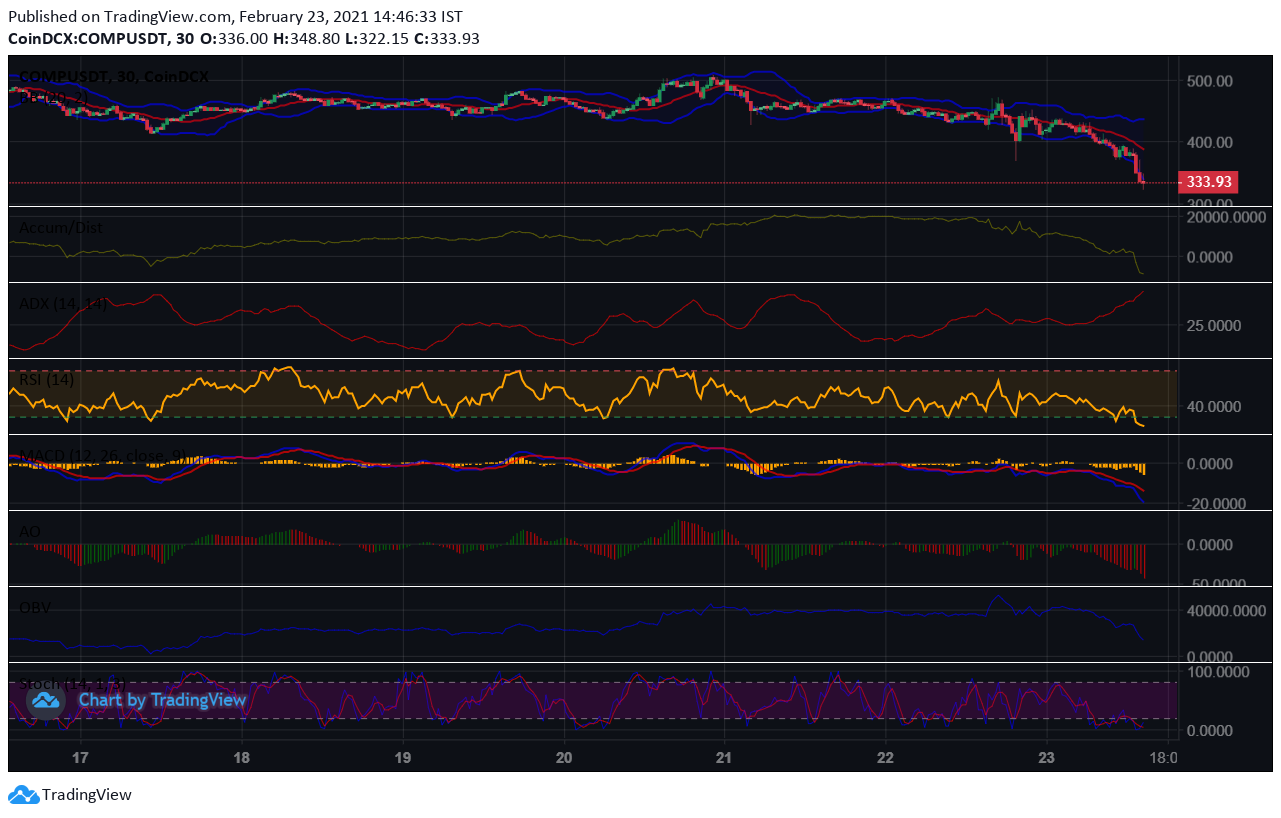
https://www.tradingview.com/x/a0LTKRhJ
Days Ahead for COMP
The opening price of COMP was $424.01 today. Presently, COMP is trading at $333.93. Thus, the COMP price is falling steeply. The price is closer to the lower Bollinger band indicating high selling pressures. The price has fallen below the 20-day SMA as well. Thus, the market looks bearish.
The OBV and A/D indicators are sloping downwards. Thus, distributions are more than accumulations. High selling volumes will exert downward pressure on the COMP price. Thus, the COMP price is likely to dip further.
The MACD and signal lines are negative too. A bearish crossover by the MACD line over the signal line gives further credence to bearish market momentum. Besides, the AO indicator is negative and giving strong signals for going short. Hence, the price will continue to fall.
The RSI indicator has fallen below the 30% mark into the ‘oversold’ region. It is steadily rallying now. However, since morning, the RSI has been facing stiff bearish swing rejection at 60%. Thus, a further fall in the COMP price is imminent.
More Indicators
Similarly, the stochastic oscillator has just started rising from the ‘oversold’ region. It is a good time for investors to go long. A bullish crossover by the actual value line of the stochastic over the 3-day SMA line indicates a temporary price rise. This is not a trend reversal but just a price correction amidst a bearish trend.
The ADX line is rising. Since the price and ADX indicator are moving in opposite directions, there is a bullish divergence here. Thus, the bearish momentum may start weakening in some time.
The price has fallen below the 23.6% FIB retracement level of $357.21. The price has also fallen below the first Fibonacci pivot support level of $348.87. By the end of the day, the price may close below the subsequent Fibonacci pivot support level of $313.82. As the bears are very strong, we can expect the price downtrend to continue tomorrow as well.