While both the Cryptocurrency Total Market Cap (TOTALCAP) and the Altcoin Market Cap (ALTCAP) have broken out above major resistance levels, the TOTALCAP is much further along in its bullish cycle.
A short-term decline could occur in both, however, the longer-term trend is likely bullish.
ALTCAP Long-Term Levels
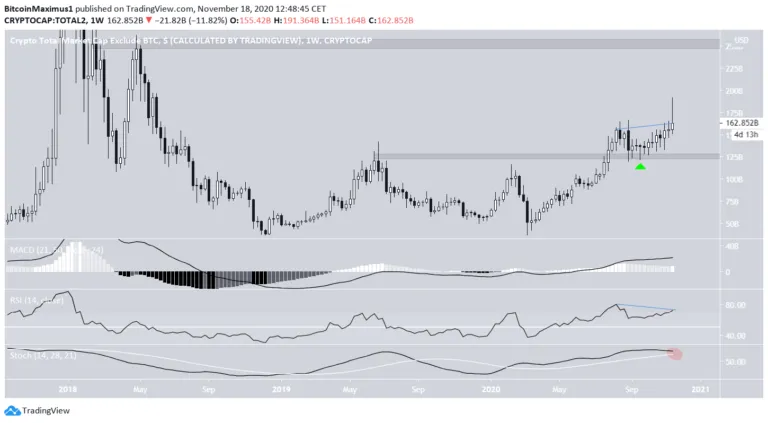
The ALTCAP broke out above the $125 billion resistance level in July and returned to validate it as support in Sept, before resuming its upward trend.
The ALTCAP recently touched a new yearly high of $166 billion before decreasing slightly. Technical indicators show weakness but have not confirmed a reversal.
While there is a possible bearish divergence on the weekly RSI, it has not been confirmed yet. Furthermore, the MACD has begun to fall while The Stochastic Oscillator is in the process of making a bearish cross. The weekly close will either confirm or reject these occurrences.
If the cap were to continue moving upwards, the next resistance area would be at $265 billion.
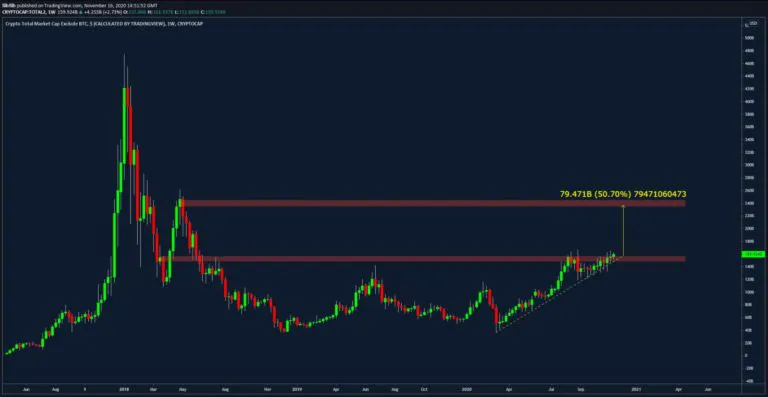
Cryptocurrency trader @FilbFilb outlined a chart of the altcoin market cap, stating that a breakout above the current resistance area could cause a rally of around 50%.
This would take the cap right to the previous $265 billion resistance area.
Double Top
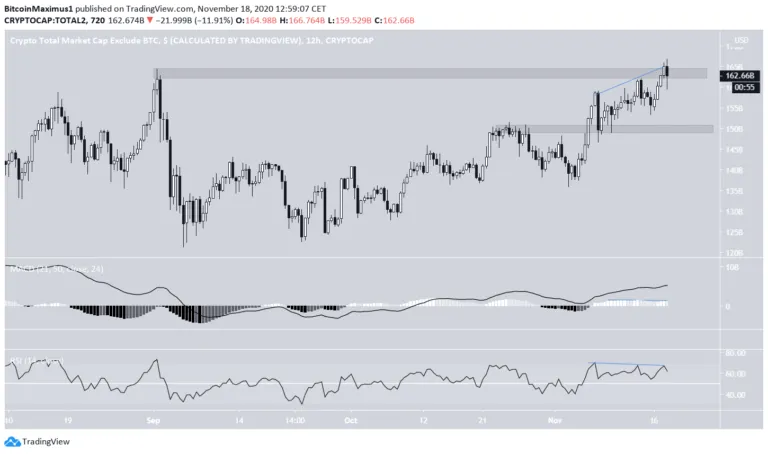
In the short-term, there is a possible double-top forming at the minor $165 billion resistance area. In addition, there is bearish divergence on both the RSI and the MACD (histogram).
If a decline occurs, there is minor support near $150 billion, the previous resistance area now turned to support.
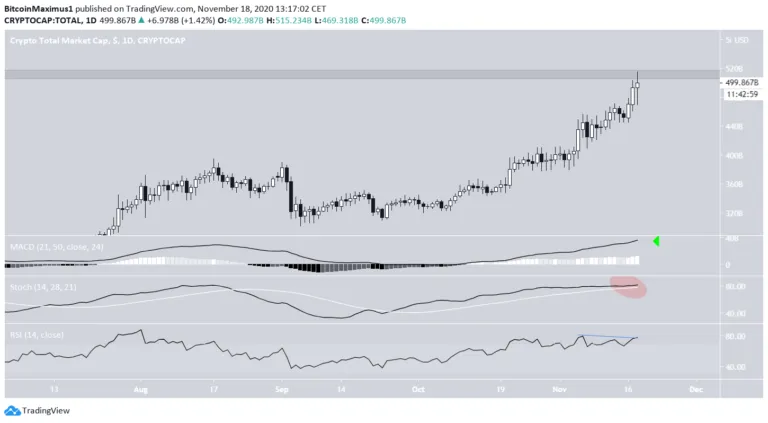
Total Market Cap (TOTALCAP) Movement
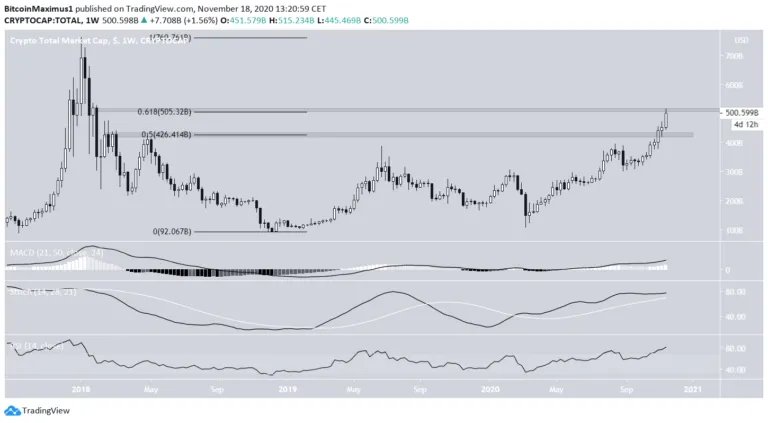
The TOTALCAP is further along in its bullish movement than the ALTCAP. It has blown right through the 0.5 Fib retracement level (measured from the all-time high in Dec 2017) at $426 billion.
At the time of writing, the cap was trading right at the 0.618 Fib retracement level of $505 billion.
While a rejection could occur, possibly to validate the 0.5 Fib level as support, the long-term trend is bullish, as long as TOTALCAP is trading above the $426 billion area.
Technical indicators do not yet show weakness, though the rally is overbought.
Similarly, the shorter-term daily chart shows an overbought trend, but no clear weakness yet, besides the small bearish divergence on the RSI.
This supports the possibility of a slight rejection from the $505 billion area, but not that of a full trend reversal.
Conclusion
To conclude, the long-term trend for both TOTALCAP and ALTCAP appears bullish. While both are trading near short-term resistance levels, allowing for the possibility of a rejection, both should rally over the long-term.
Disclaimer: Cryptocurrency trading carries a high level of risk and may not be suitable for all investors. The views expressed in this article do not reflect those of BeInCrypto