It is another weekend in the crypto markets and the digital asset of ChainLink (LINK) has completed 8 days above the $10 psychological price level. Back in late September and early October, ChainLink’s future was a bit bleak with the digital asset facing a possible future at the $7 price area. However, ChainLink managed to bounce hard from the $8.80 support area and is currently trading at $10.60.
ChainLink’s 50 and 100 day MAs Proving to be Tough for LINK
Further taking a quick glance at the 1-day LINK/USDT chart courtesy of Tradingview.com, it can be observed that ChainLink is currently facing stiff resistance from both the 50-day (white) and 100-day (yellow) moving averages as can be seen in the chart below.
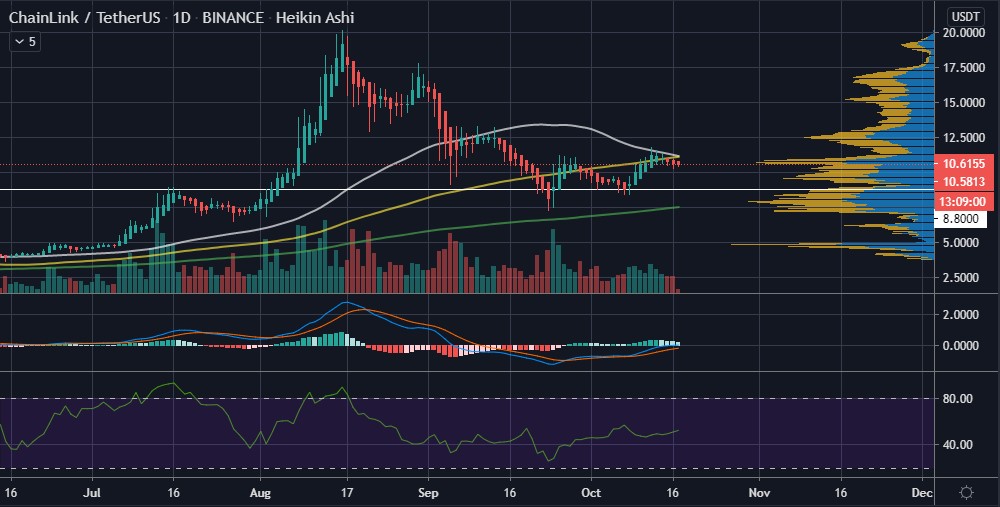
Also from the chart, the following can be observed.
- The 50-day and 100-day moving averages are providing stiff resistance at the $11 to $11.20 price area
- Another considerable area of resistance for Chainlink is between $10.80 and $10.90
- Daily trade volume is in the red indicating a continual level of selling
- The histograms of the daily MACD are also confirming selling activity
- The daily MFI is at 52 which is neutral territory and could hint of possible sideways for Chainlink in the days to follow
- The 200-day moving average provides an area of support of around $7.50
ChainLink Might Not Drop to $7
With respect to the support at $7.50, it had been stated in an earlier analysis that ChainLink looked less likely to drop to the $7 price level based on the analysis of veteran Crypto analyst, Timothy Peterson, of Cane Island Alternative Advisors. His analysis pointed out that ChainLink has had a long-running relationship with the price of Bitcoin. This means that if Bitcoin continues with its upward trajectory, LINK is bound to follow a similar path as BTC.
Below is Mr. Peterson’s analysis which he shared via Twitter.
$LINK may never hit $7. This relationship between #ChainLink and #Bitcoin goes back 2+ years. However it is just a price extrapolation – maybe ok in the short term but questionable in the long term. Could also go sideways for a year like 2019. pic.twitter.com/9kTCA7jrJ9
— Timothy Peterson (@nsquaredcrypto) October 13, 2020
Conclusion
Summing it up, Chainlink’s 50-day and 100-day moving averages are proving to be difficult obstacles for LINK at the $11 – $11.20 price area. Furthermore, LINK looks set for additional sideways movement above the $10 psychological level based on the daily MFI being in neutral territory.
With the weekly close only a few hours away, ChainLink closing above $10 is desirable for LINK as it strives to break the resistance zone set by the two MAs. In terms of support, $8.80 continues to be very strong and could once again prevent LINK from dropping further.
As with all analyses of ChainLink, traders and investors are advised to use adequate stop losses and low leverage when trading LINK on the numerous derivatives platforms.