The Matic Network (MATIC) price has returned to a support level that has been in place since May.
The lack of a strong reaction from the area suggests that the price will eventually breakdown.
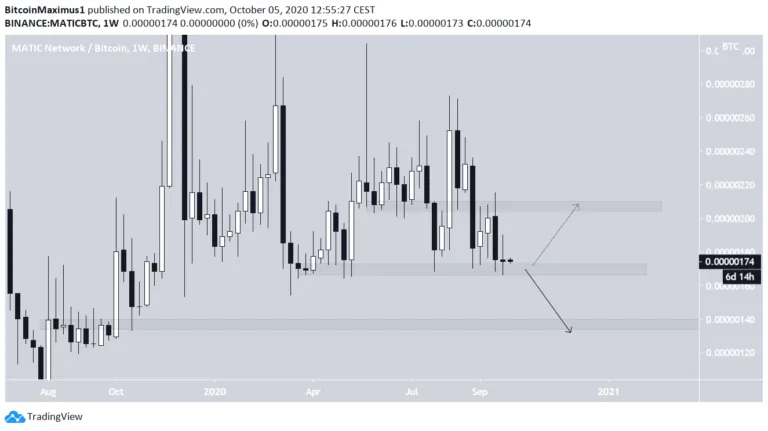
MATIC Long-Term Support
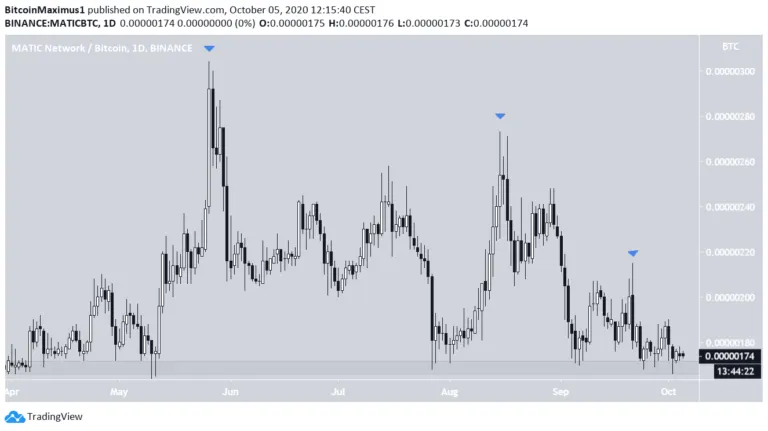
At the beginning of May, the MATIC price reached the 170 satoshi support level and began an upward move that led to a high of 304 satoshis being reached. However, the higher prices could not be sustained and MATIC has been decreasing since.
While MATIC has revisited the support area multiple times, each bounce has been weaker than the preceding one, a sign of diminishing buyer strength.
A breakdown from the 170 satoshi support could potentially trigger a sharp drop.
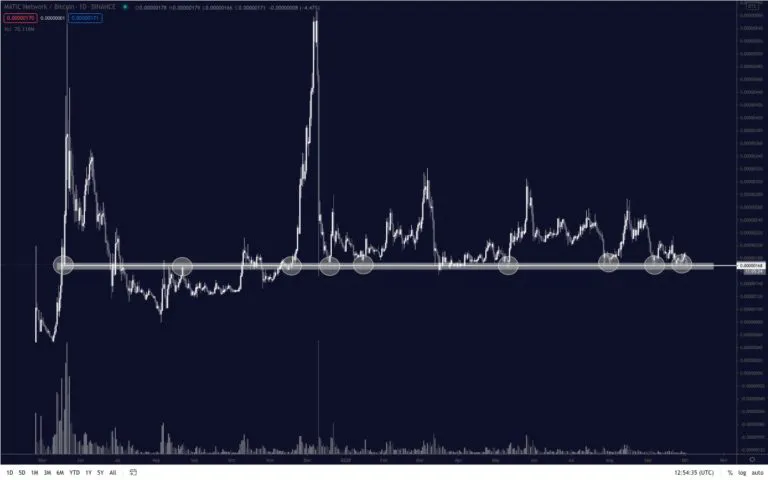
Cryptocurrency trader @Pentosh1 outlined a MATIC chart which shows that the price is re-testing a long-term support level that has initiated numerous bounces.
Potential Breakdown
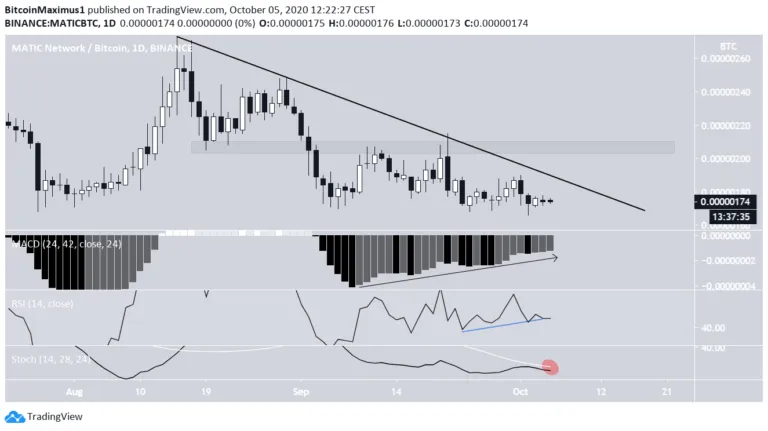
A closer look at the daily chart shows that the price is following a descending resistance line that is found within the 170 satoshi support area, and created a descending triangle. which is normally considered a bearish reversal pattern.
Technical indicators are leaning on being bullish, but have not confirmed anything yet. While the MACD is increasing and the RSI has generated bullish divergence, the latter is below 50 and the Stochastic Oscillator has not yet made a bullish cross.
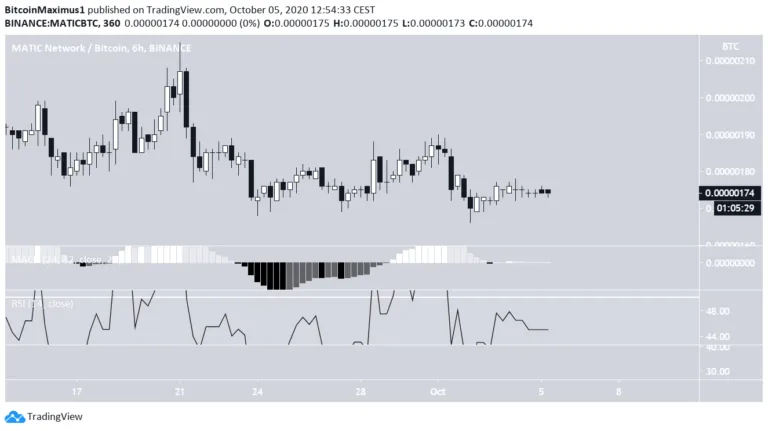
The six-hour chart does not show any bullish reversal signs whatsoever. This makes a breakdown from the support area the most likely option since there are no clear signs to suggest the contrary will occur.
Conclusion
To conclude, the two likeliest possibilities for Bitcoin’s movement is either a breakdown from the 170 support area or a bounce upwards toward the 205 satoshi resistance area.
Due to the diminishing strength and lack of bullish reversal signs, the former scenario option seems more likely.
Disclaimer: Cryptocurrency trading carries a high level of risk, and may not be suitable for all investors. The views expressed in this article do not reflect those of BeInCrypto.