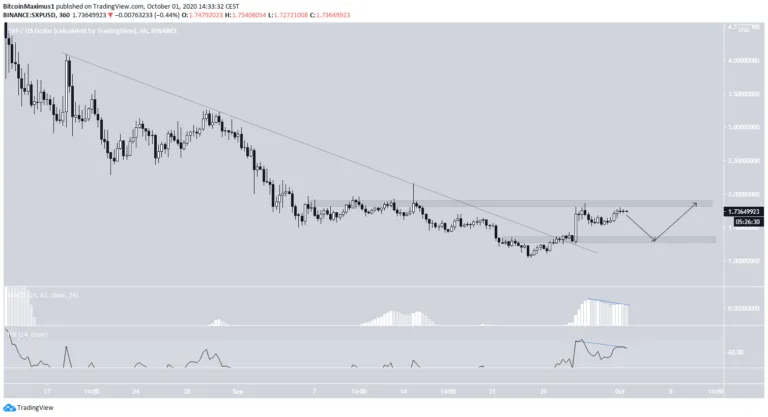
The Swipe (SXP) price has broken down and subsequently reclaimed a critical support level at $1.55.
As long as the price is trading above here, it should continue moving upwards.
Reclaim of Support
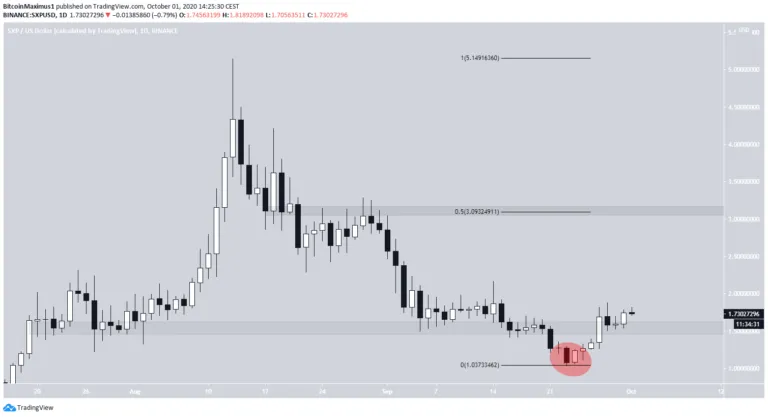
On Aug 13, the SXP price reached a high of $5.15 and began a downward move that is still ongoing. The price reached a low of $1.48 on Sept 14 and began to rise.
While it initially seemed like the price had broken down from the $1.55 support area, it proceeded to move upwards and reclaim the previously lost support level. Deviations below a support area and their subsequent reclaim often lead to a significant move in the other direction.
If the price continues moving upwards, the closest resistance area would be found at $3.10, the 0.5 Fib level of the entire previous decline.
Short-Term Movement
Cryptocurrency trader @CryptoNewton outlined an SXP chart, stating that he has entered a long and expects the price to continue moving upwards.
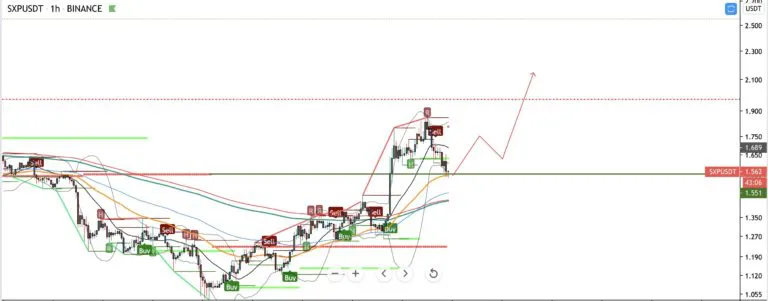
While the price has indeed broken out from a descending resistance line, the price was rejected at the $1.90 resistance area and is in the process of creating a double top, known as a bearish reversal pattern.
In addition, both the RSI and the MACD have formed bearish divergence. This signifies that the price is likely to fall initially, possibly towards $1.30, before making another attempt at breaking out.
Wave Count
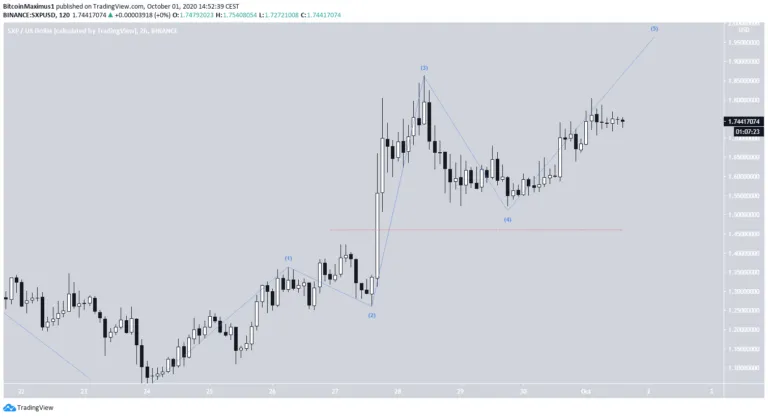
As for the wave count, it seems that SXP has completed an A-B-C corrective structure (in black below) with its previously mentioned low of $1.48 on Sept 14. Waves A:C have a 1:1 ratio, and a bearish impulse can be outlined in the C wave (blue), making this likely to be the correct wave count.
If so, then SXP has begun an upward move since Sept 14 (highlighted).
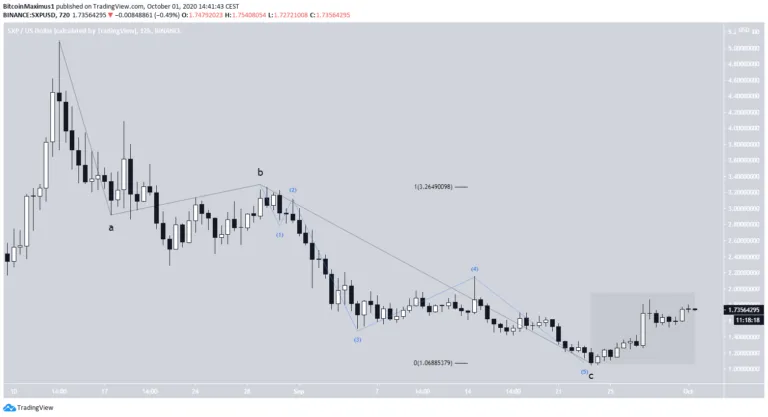
A closer look shows that the rally looks impulsive and will take it at least to the $3.10 resistance area outlined in the first section.
To conclude, the SXP price has possibly completed its correction and is now likely to continue moving upwards towards the resistance areas outlined above.