- Tron price failed to stay above the key $0.0320 and $0.0300 support levels against the US Dollar.
- TRX price is now trading below the $0.0285 support and the 55 simple moving average (4-hours).
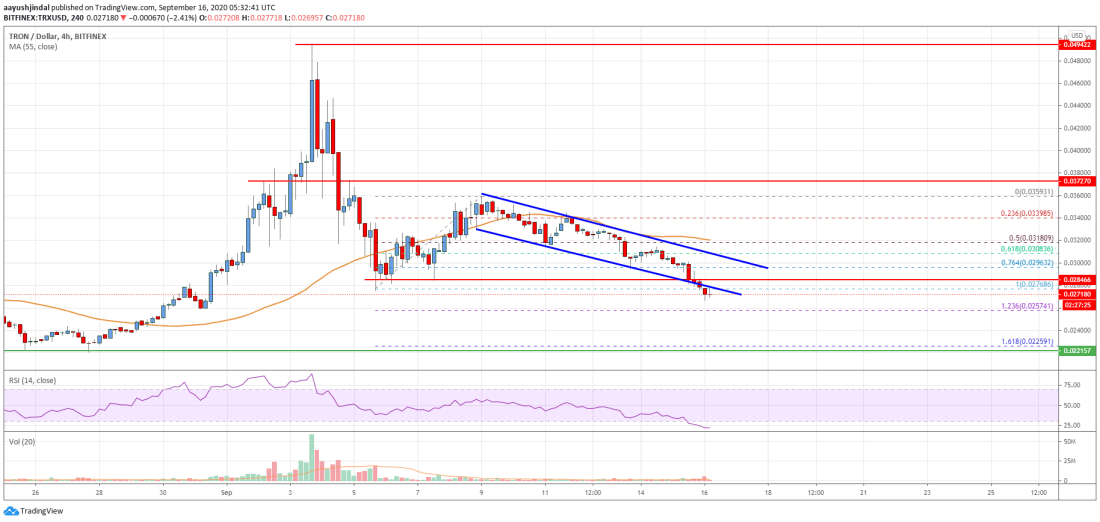
- There was a break below a declining channel with support near $0.0276 on the 4-hours chart (data feed via Bitfinex).
- The pair is likely to continue lower towards the $0.0225 support zone in the near term.
TRON price failed to hold gains and declined steadily against the US Dollar and bitcoin. TRX price is showing bearish signs below the $0.0300 and $0.0285 support levels.
Tron Price Analysis
After struggling to gain pace above $0.0360, TRON price started a steady decline against the US Dollar. TRX price broke many supports near the $0.0320 and $0.0300 levels to move into a bearish zone.
There was also a close below $0.0300 and the 55 simple moving average (4-hours). More importantly, there was a break below a declining channel with support near $0.0276 on the 4-hours chart. The pair even broke the key $0.0285 support and the last swing low at $0.0276.
The next major support is near the $.0258 level. It is close to the 1.236 Fib extension level of the key move from the $0.0276 swing low to $0.0359 high. If the bears remain in action, there are chances of more losses below $0.0258.
The next major support is near the $0.0225 pivot level. It coincides with the 1.618 Fib extension level of the key move from the $0.0276 swing low to $0.0359 high. Any further losses may perhaps lead tron price towards the $0.0200 support zone.
On the upside, the price is likely to face hurdles near the $0.0285 level (the recent breakdown zone). The next major resistance is near the $0.0300 level and the channel upper trend line.
If tron price clears the $0.0285 and $0.0300 resistance levels, there are chances of a decent recovery wave. In the stated case, the bulls are likely to aim a test of the $0.0320 resistance zone or the 55 simple moving average (4-hours).
Tron (TRX) Price
The chart indicates that TRX price is clearly facing an increase in selling pressure below $0.0300 and $0.0285. Overall, the price is likely to continue lower towards the $0.0225 support zone in the near term.
Technical Indicators
4 hours MACD – The MACD for TRX/USD is now gaining strength in the bearish zone.
4 hours RSI – The RSI for TRX/USD is currently declining and it is in the oversold zone.
Key Support Levels – $0.0258 and $0.0225.
Key Resistance Levels – $0.0285, $0.0300 and $0.0320.