VeChain Price Analysis – August 28
The bears are testing the $0.015 psychological support level and aiming to penetrate it and hit the potential support levels at $0.013 and $0.011. At the upper side of the chart, the coin may face the resistance level at $0.017, $0.018, and $0.020 in case the demand level at $0.015 hold.
VET/USD Market
Key Levels:
Resistance levels: $0.017, $0.018, $0.020
Support levels: $0.015, $0.013, $0.011
Started from the beginning of July the buyers are the controller of the VET market. This is noticed clearly with the increase in price from the demand level at $0.011 to $0.020 within a week. The price was pulled back to test the demand level at $0.015 level. The price bounced and the bullish trend continues on 30 July and the price increased to break up the previous high level. It reaches $0.022 level. An inside bar candle pattern emerges and the price descends currently testing the demand level of $0.015.
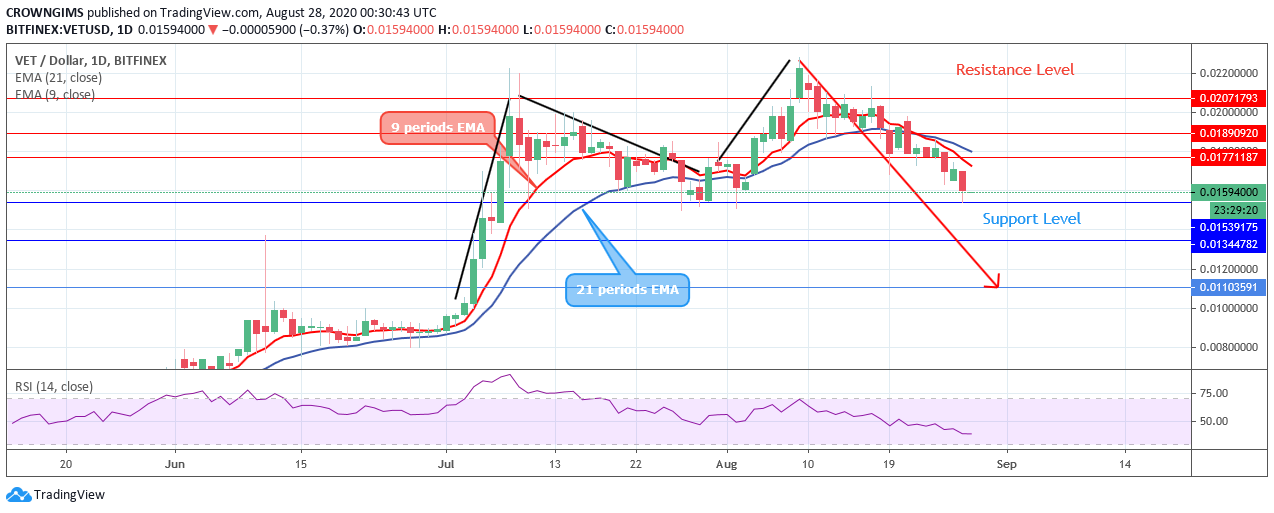
Technically, at the daily chart, VET/USD is already in the hands of the bears as the Relative Strength Index indicator period 14 supports the bearish action with its signal line pointing downward at 30 levels. The price has crossed the two EMAs downside and the price trading below the dynamic resistance level. Meanwhile, bears are testing the $0.015 psychological support level and aiming to penetrate it and hit the potential support levels at $0.013 and $0.011. At the upper side of the chart, the coin may face the resistance level at $0.017, $0.018, and $0.020 in case the demand level at $0.015 hold. Place Sell Stop at $0.014, Take Profit at $0.011 and Stop Loss at $0.018.
VET/BTC Market
By placing VeChain with BTC, the price is bearish. The increase in price was rejected at the resistance level 16670 SAT. The price is completing the formation of short “M” chart pattern; this is a bearish chart pattern and the price has passed through the barrier at 16400 SAT trying to break down the support level at 13800 SAT.
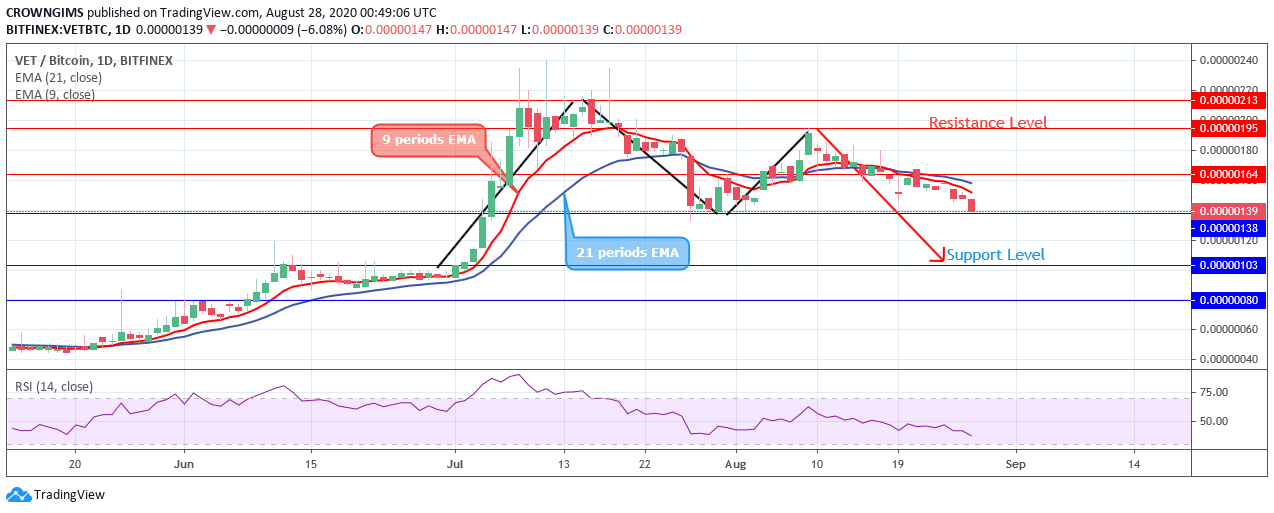
In case of VeChain price could not cross below the 13800 SAT level, the coin may likely move towards the resistance at 16400 SAT and 19500 SAT. The RSI indicator periods 14 is bending towards south at 30 levels indicate sell signal.