XRP’s recent rally has taken a pause, leaving crypto investors scratching their heads wondering which way the altcoin will turn next. Will it fall deeper into the throes of the bear market, or will the asset finally repeat the performance that took it to over $3.50 per token?
If a strength measuring tool is any indicator of what’s to come, Ripple may be looking at a repeat of its crypto bubble breakout setting a new record all-time high.
XRP Rally Pauses, Will Bears Regain Control, Or Are Altcoin Bulls Fully In Charge?
XRP went from the worst-performing asst two years running, to the crypto market’s top performer week-over-week just a couple of weeks back. Now, nothing.
The asset has taken pause after an inial pullback on the XRPUSD pair, driven by Bitcoin profit-taking and an overheated crypto market as a whole.
Related Reading | Crypto Is Up Over 80% in 2020—and Google Users Are Taking Notice
It has now been almost two weeks of indecision, and an evening star doji could form on the weekly if a drop begins from here. But while bulls and bears may be at an impasse momentarily, the Relative Strength Index on weekly XRPUSD price charts shows that bulls may be more in charge than price action indicates.
In fact, the weekly RSI is showing the strongest levels on the altcoin asset since 2016, just ahead of the incredible cryptocurrency bubble began inflating full steam.
If history repeats, and as Mark Twain said, it often rhymes, Ripple may see its rebound kick into high gear and rocket toward a new all-time high sooner than later.

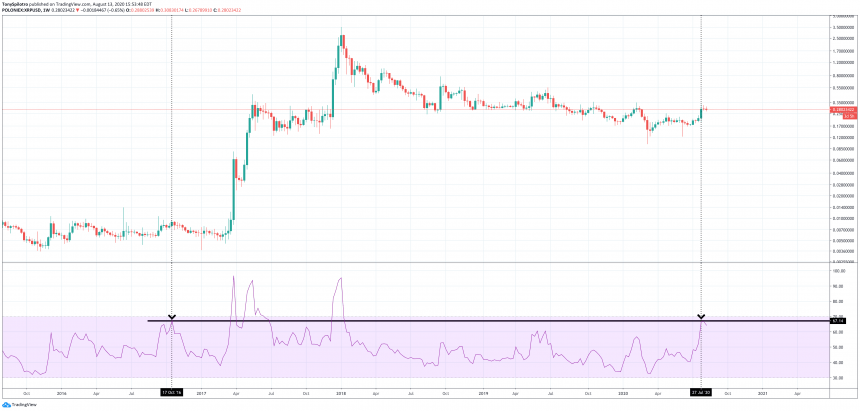
Ripple Weekly Price Chart - Relative Strenght Index | Souce: TradingView
Relative Strength Index Indicates Ripple May Be Ready For Liftoff, Repeat Of Crypto Bubble Performance
The Relative Strength Index is a momentum indicator that gauges when an asset reaches overbought or oversold conditions. Typically, when RSI readings are high and over 70 signal that the asset is overbought and could be reversing.
Traders and analysts use it to time tops and bottoms. However, high readings on the RSI also could suggest that the momentum is so strong, even though the asset is overbought it could keep rising right along.
RSI on XRP weekly price charts hasn’t yet made it over 70, but it has reached a level that preceded its bull market breakout in 2017. After reaching this level, a pullback took place and the cryptocurrency traded sideways for another few months.
Bearish Take | XRP: Why A Weekly Close Below 25 Cents Could Spark A Strong Reversal
Then suddenly, Ripple blasted off by first 900% in two weeks, 5000% in two months, and finally a full 50,000% within a year. The total run took XRP from under a penny per token to over $3.50 at the peak.
A full 99% fall back to ten cents took place, but Ripple has since been on the rebound, recovering 200% since its Black Thursday bottom before the latest pullback.
Does the RSI show that the altcoin is ready to blast off once again?