Following this year’s block rewards reduction event in mid-May, the flagship cryptocurrency entered a consolidation period without providing any clear signs of where it is headed next. Since then, its price has mostly traded between the $8,900 support level and the $10,000 resistance.
Throughout this time, Bitcoin has failed to close below or above these price hurdles to help determine the trend’s direction. The lackluster price action also forced the Bollinger bands to squeeze on BTC’s 3-day chart. Squeezes are indicative of low volatility phases and are usually succeeded by wild price movements.
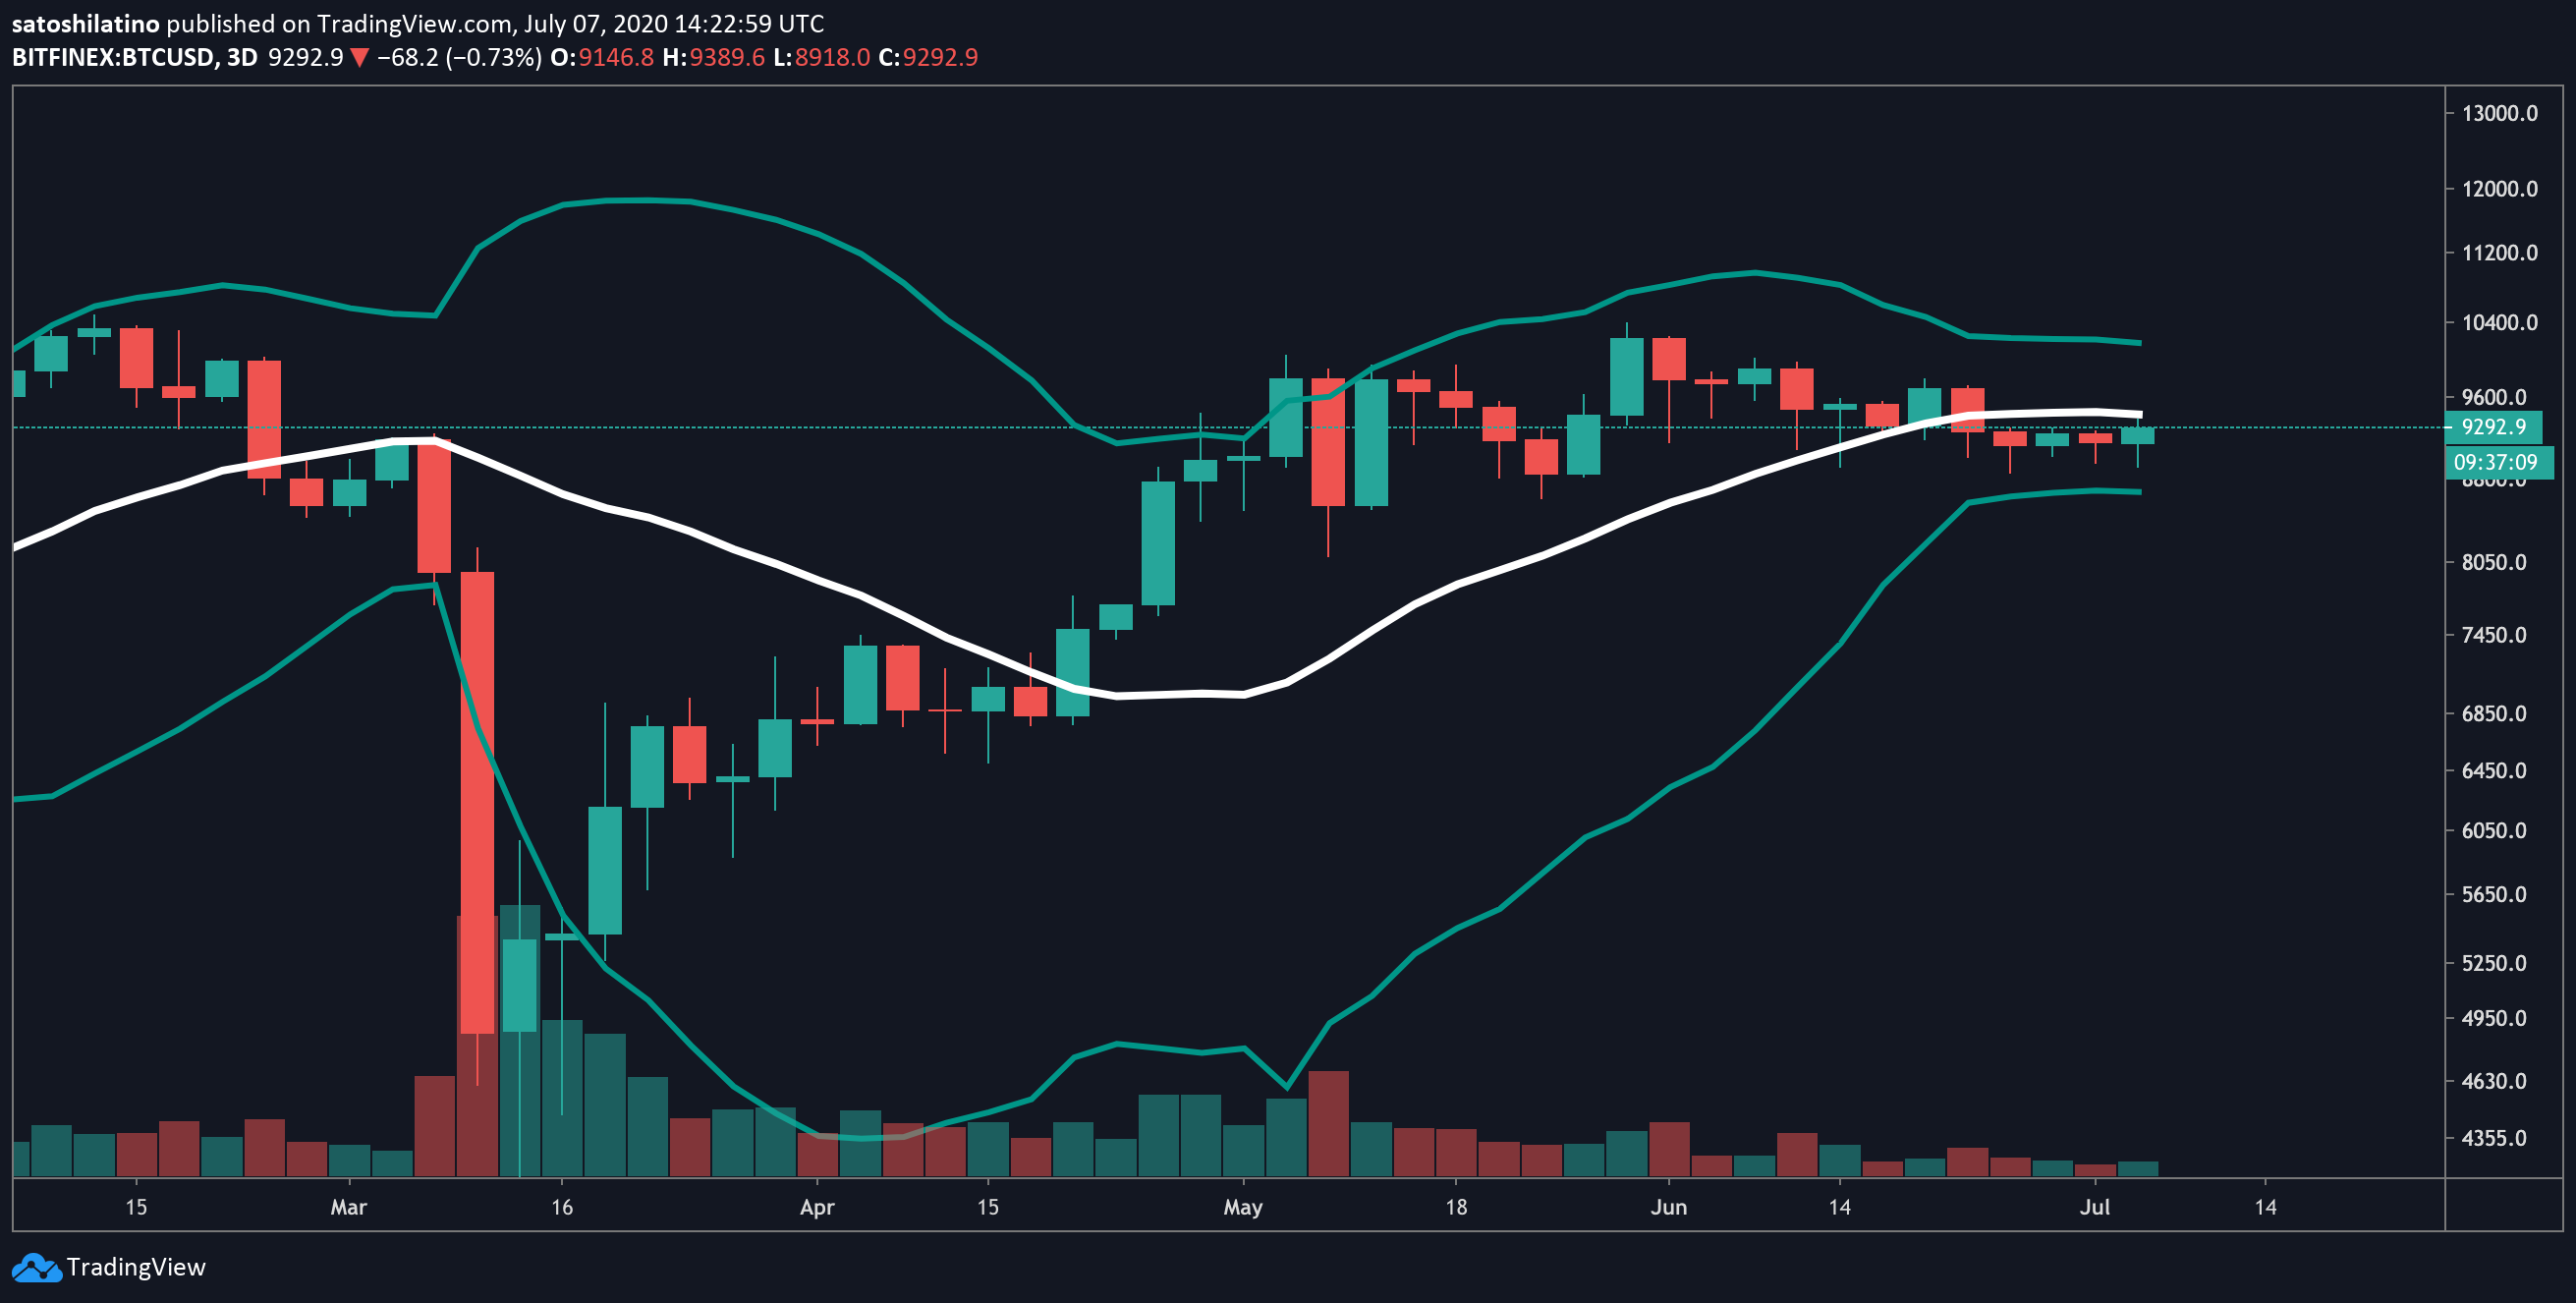
Bollinger Bands Forecast Incoming Volatility. (Source: TradingView)
While Bitcoin sits on the cusp of a major price movement, investors seem confident of its upside potential and continue holding strong to their tokens.
Bitcoin Holders Continue to “HODL”
In a recent blog post, Daniel Ferraro, Marketing Director at IntoTheBlock, affirmed that the number of Bitcoin “hodlers” on the network has been trending up for over the past twelve months. These are defined as addresses holding BTC for more than one year.
Even after the global financial turmoil caused by the ongoing pandemic, the steady increase in the number of BTC “hodlers” has been uninterrupted.
“The number [of Bitcoin ‘hodlers’] reached 20 million, or roughly two-thirds of all addresses with a balance. Similarly, approximately 60% of the circulating supply of Bitcoin is held by these addresses with an average time held of 4.7 years,” said Ferraro.
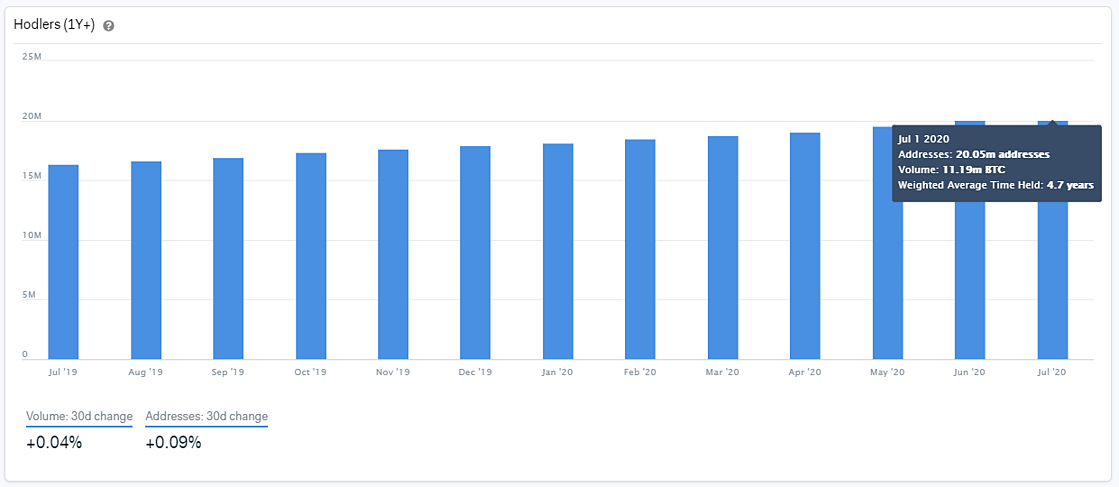
The Number of Bitcoin Hodlers Continues Surging. (Souce: IntoTheBlock)
Higher Highs on the Horizon
The high levels of demand for Bitcoin are also reflected in its 3-day chart despite the lackluster price action. Within this time frame, the TD sequential indicator is currently presenting a buy signal in the form of a red nine candlestick.
The bullish formation estimates a one to four candlesticks upswing or the beginning of a new upward countdown. Based on the price history of the last two months, the bellwether cryptocurrency might be preparing to surge towards the setup trendline that sits around the infamous $10,000 resistance level.
A further spike in the buying pressure behind BTC that allows it to break above this supply barrier would likely entice other market participants to pile in and propel its price to $11,500 or higher.
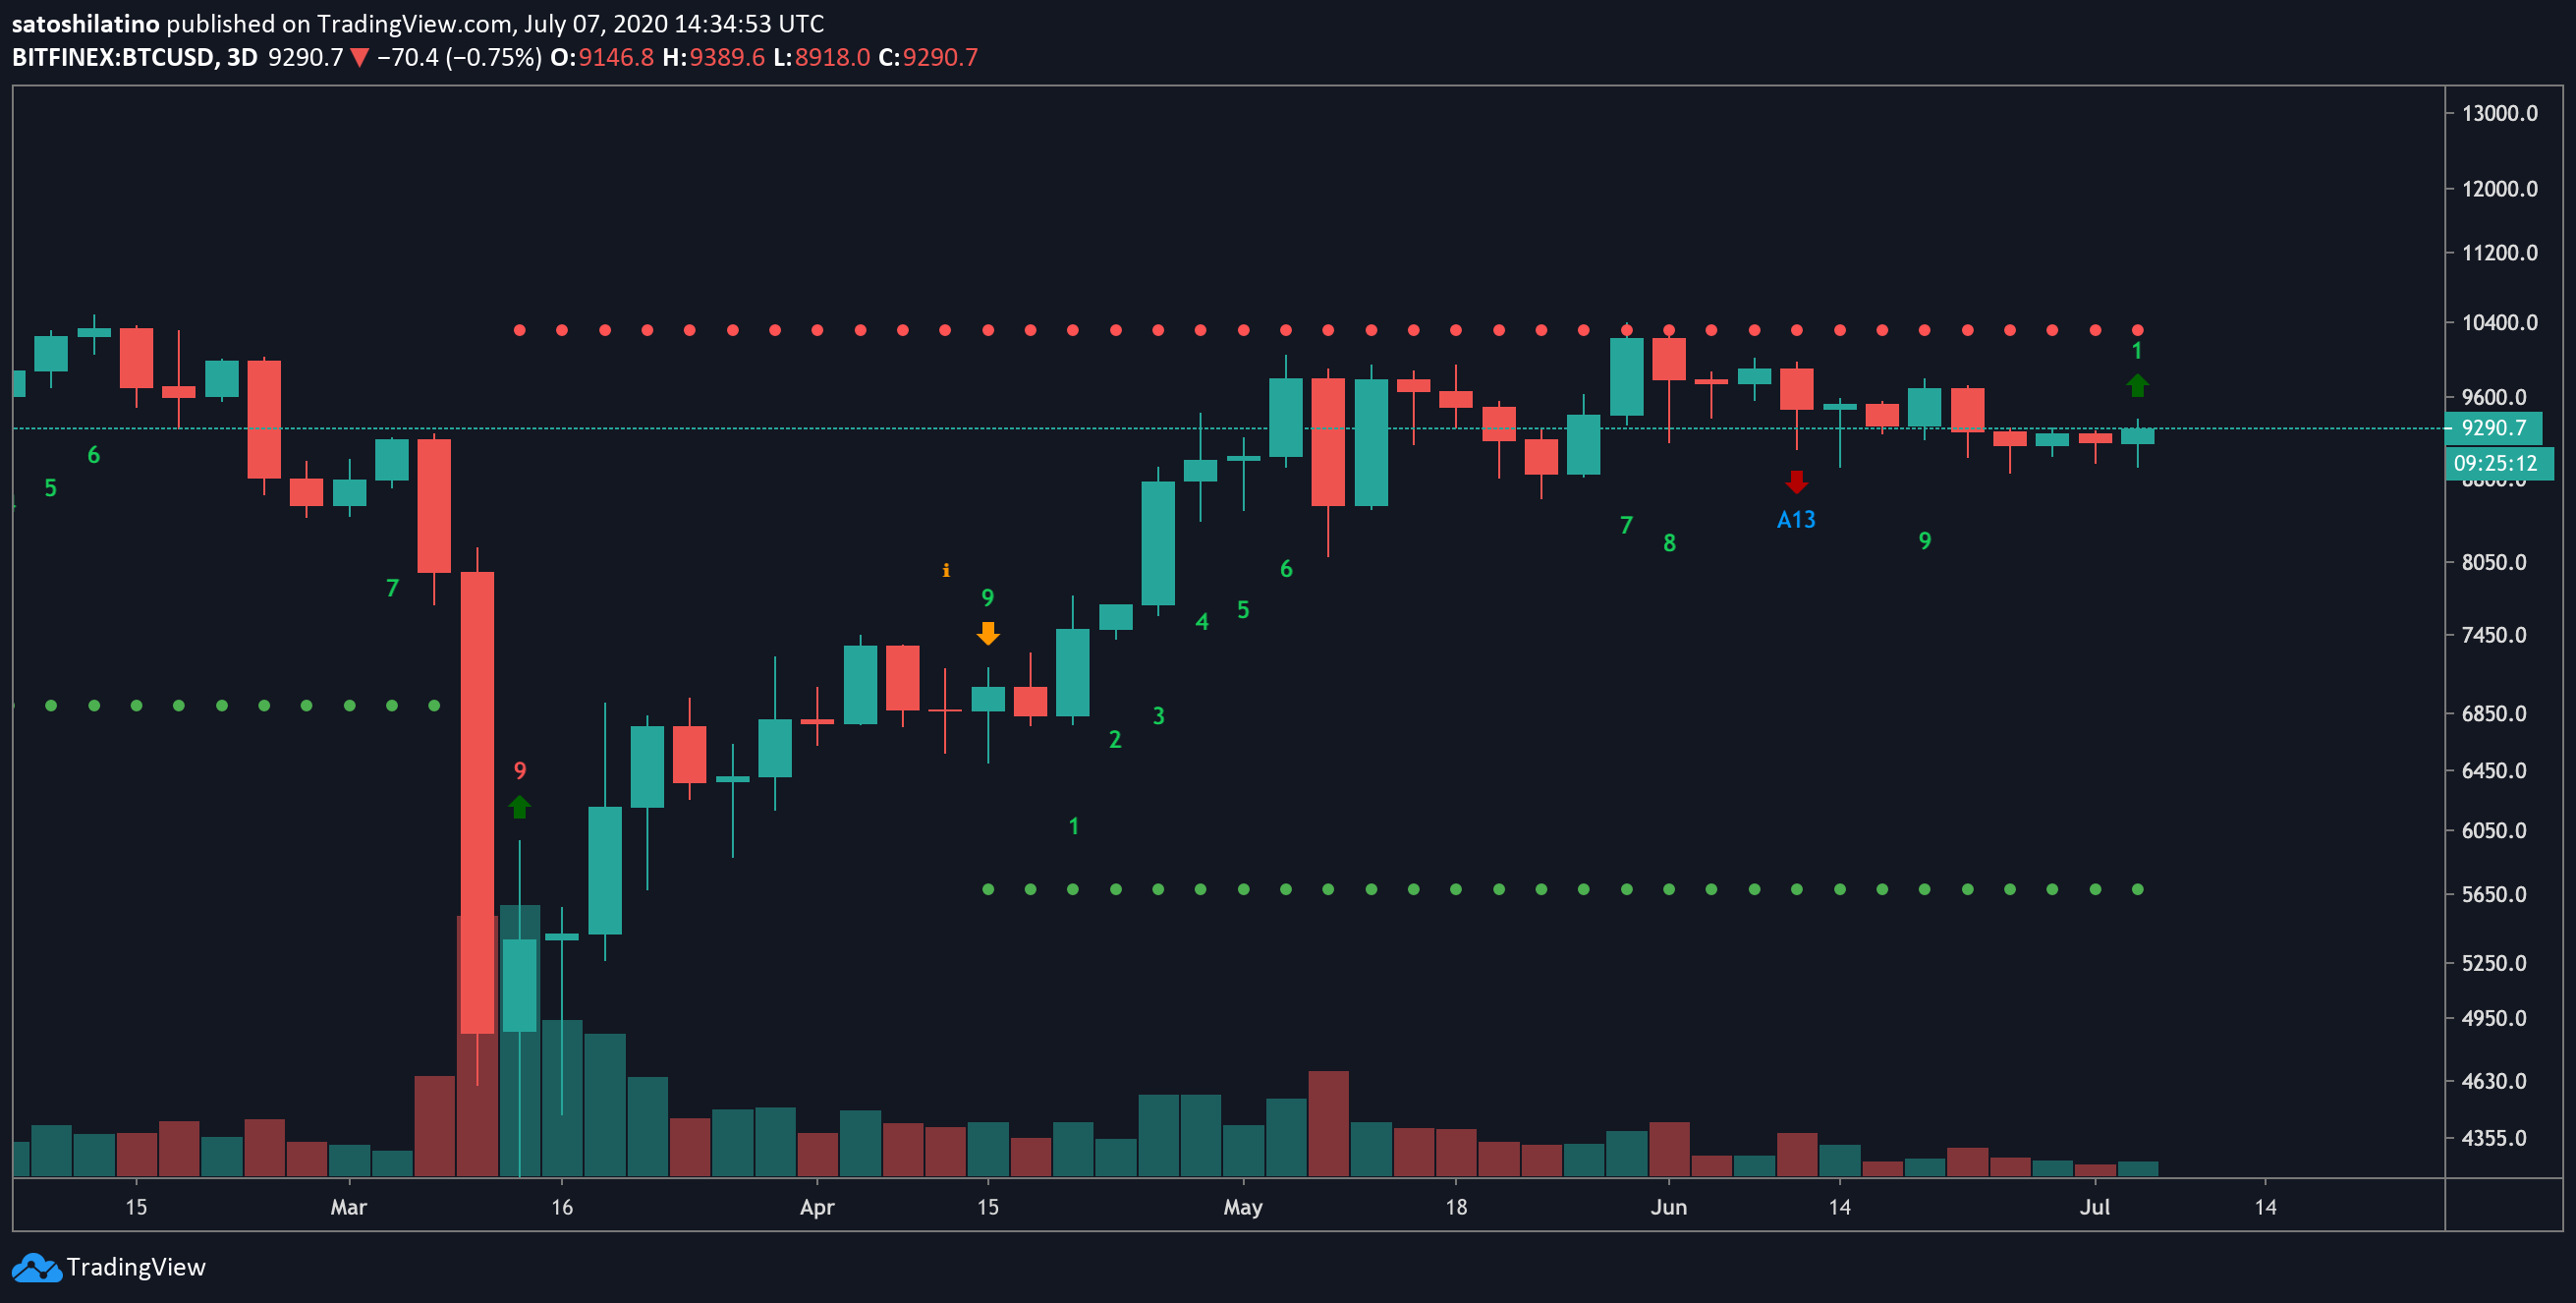
TD Setup Presents Buy Signal for Bitcoin. (Source: TradingView)
Still, investors should implement a robust risk management strategy since losing the $8,900 level as support would likely invalidate the bullish scenario presented by the TD setup. Under such circumstances, Bitcoin might test the $7,700 support level before resuming its historic uptrend.
Given the ambiguity that Bitcoin presents, a small dose of patience could help traders benefit from the next major price movement. Regardless of the volatility, the $8,900 support level and the $10,000 resistance are the most critical hurdles to watch out.
Featured by Shutterstock.
Charts from TradingView.com