- A weekly close beneath $0.075 and the 3-month trend line suggest a strong correction.
- The price dropped by 8.5% following a weekly bearish close around $0.07.
XLM/USD: Stellar Broke Below 3-Month Trend Line
Key Resistance Levels: $0.0738, $0.080, $0.086
Key Support Levels: $0.0627, $0.0523, $0.045
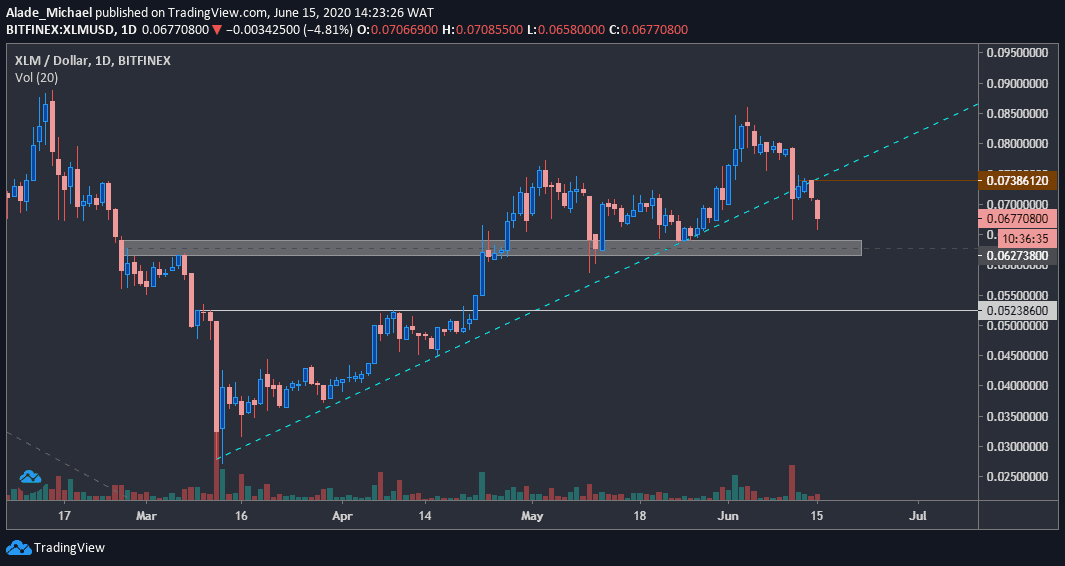
The latest dump in the entire crypto space has caused a significant loss in Stellar’s price over the past hours. Earlier this month, it traded as high as $0.086 after seeing a three-month recovery from $0.027 in March.
But currently, the price is trading around $0.0678 after losing almost 20% in two weeks. The weekly close below the 3-month ascending trend line – as can be seen in the above chart – indicates a strong sell signal for this pair.
Meanwhile, the daily 8.5% correction is now driving the price towards a critical demand area (marked grey on the price chart). If the bears continue to accelerate the pressure, heavier drops could be expected in the coming days.
XLM Price Analysis
The bears may be suspended for a while if this crucial demand area of $0.0627 holds strong. However, it could paint an uglier scenario if a break down takes place. For such a move, the potential support to watch lies at $0.0523, followed by $0.045, which is slightly below the white horizontal line.
But if XLM manages to establish support around this grey demand area, it may regain momentum back to $0.0738 resistance – from where it initiated the selling yesterday – before climbing further to $0.08 level. Resistance above this level is $0.086, where the major correction started on June 4.
Considering the new weekly close below $0.075, it is essential to note that the bears are back in the market.
XLM/BTC: Stellar Continues To Stumble At 1000 SAT
Key Resistance Levels: 786 SAT, 815 SAT, 844 SAT
Key Support Levels: 700 SAT, 669 SAT, 650 SAT
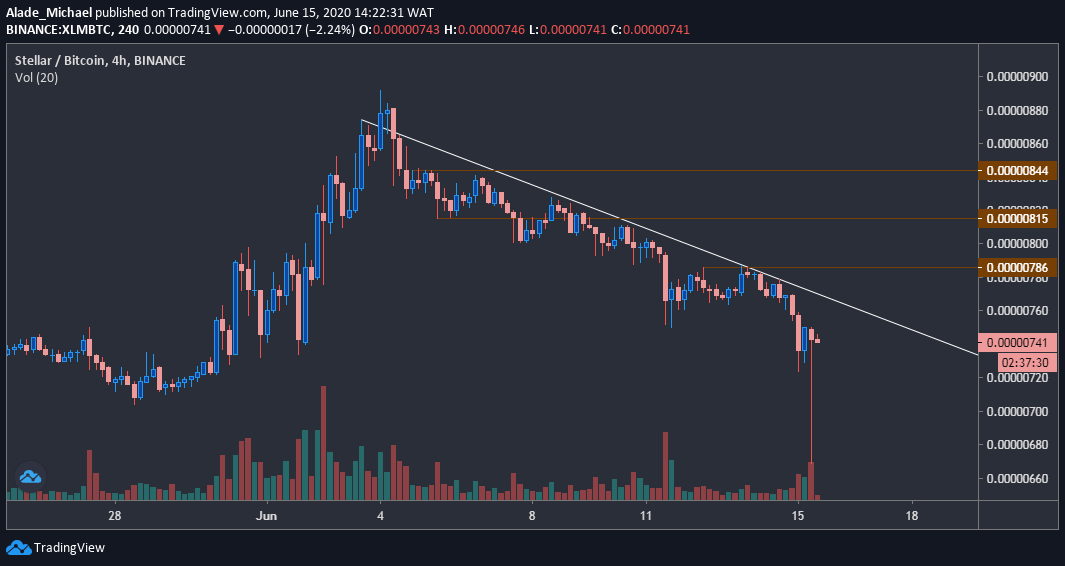
After a series of rejections at 1000 SAT level since June 2019, Stellar’s price continued to roll back to base support at around 700 SAT over the past month. But the price just wicked at 669 SAT following a steady decline from 892 SAT over the past ten days.
This selloff was led by the recent drop in Bitcoin’s price below the $9000 level earlier today. Meanwhile, the reversal candle (pin bar) spotted on the 4-hours chart indicates temporary exhaustion in selling.
A close above the white regression line, around 760 SAT should send a strong buy signal for this pair. On the other hand, Stellar could remain bearish if the white line continues to form.
XLM Price Analysis
Stellar is changing hands at around 740 SAT at the time of writing. If the price continues to drop, it may revisit June 2019’s support at 700 SAT, which has been acting as base-support for the past 12 months now.
The 669 SAT level is still holding as daily low. 650 SAT will be next if it breaks down.
Towards the upside, the price is facing an important resistance line. A breach above this line should allow an excellent recovery to the upside. There is a lot of resistance ahead, but the key level to watch is 786 SAT, followed by 815 SAT. The next resistance to watch is the 844 SAT level in case of a further push.