- XTZ, the native cryptocurrency of the Tezos blockchain platform, recently defeated a long-standing Head & Shoulder pattern.
- If successful, the bearish technical indicator could have crashed XTZ to as low as 523 sats.
- Its failure now puts the crypto en route to record highs.
XTZ is trading almost 28 percent lower from its all-time high at 4,073 sats, but the cryptocurrency has enough fuel to retest the top.
The upside sentiment for the Tezos blockchain’s native asset takes cues from its recent response to a bearish technical indicator. Since it started trading in 2019, the XTZ/BTC daily chart was gradually forming a Head & Shoulder pattern, hereto H&S.
The classic indicator appears after an asset form three price highs, with the middle peak highest than the other two. Meanwhile, these peaks stand on a price floor called the neckline. Together, they appear like two shoulders with one head in the middle, which explains the term H&S.
A Winning Cryptocurrency
Traders perceive H&S as a bullish-to-bearish trend reversal indicator. Despite its standalone limitations, the pattern is prevalent in predicting an asset’s potential negative breakouts and their downside targets. XTZ was making a similar indicator on its bitcoin-focused chart, as shown below.
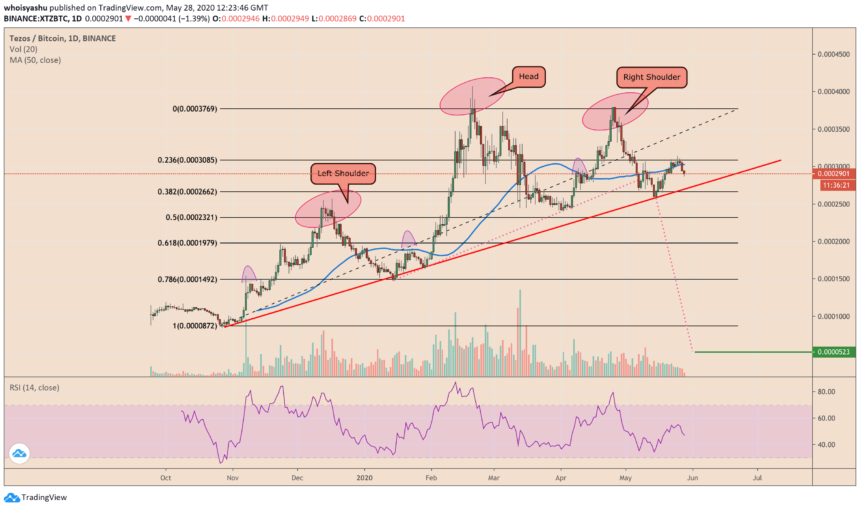
H&S formation on the Tezos token’s chart | Source: TradingView.com, Binance
The circled peaks represent XTZ’s head and shoulders, while the red ascending trendline is its neckline. After confirming the Right Shoulder peak on April 25, 2020, the XTZ/BTC rate corrected lower to retest the redded floor.
Ideally, the pair could have broken below it to establish a downward breakout move to as low as 523 sats – the price target of the H&S pattern. But instead, it established the neckline as its support, invalidating the technical indicator entirely.
The price jumped by as much as 21 percent after testing the red line.
The overall move verified the redded Ascending Trendline as a crucial support level for XTZ. A favorable buying sentiment near the line kept the cryptocurrency from dwelling into risky bearish territories. As a result, XTZ remains one of the best performing crypto tokens in 2020, beating even its top rival, Bitcoin.
What’s Next
Supported by optimistic fundamentals, XTZ would most likely retest the red trendline for a pullback towards its 23.6% Fibonacci level – at 3,085 sats. Meanwhile, a break above the said resistance would set its upside target towards 3,769-4,073 sats range.
Bitcoin’s corrective sentiments could also support XTZ’s uptrend. As the top crypto remains capped by its long-term Descending Trendline, it would move profit-seekers to the altcoin market, benefitting rivals like Tezos and Ethereum.