With the third-ever Bitcoin halving in the history books, the price of the asset is reacting by a notable 13% surge. As a result, the number of profitable days of holding the primary cryptocurrency has increased to over 93%, according to a data monitoring website.
Almost All BTC Positions Are In Profit
Bitcoin’s halving historically attracts a lot of attention. This one was no exception. While there were a lot of predictions that the price would tumble mainly because of miner-induced selling pressure, BTC has so far defied them all, gaining over $1,000 since the halving.
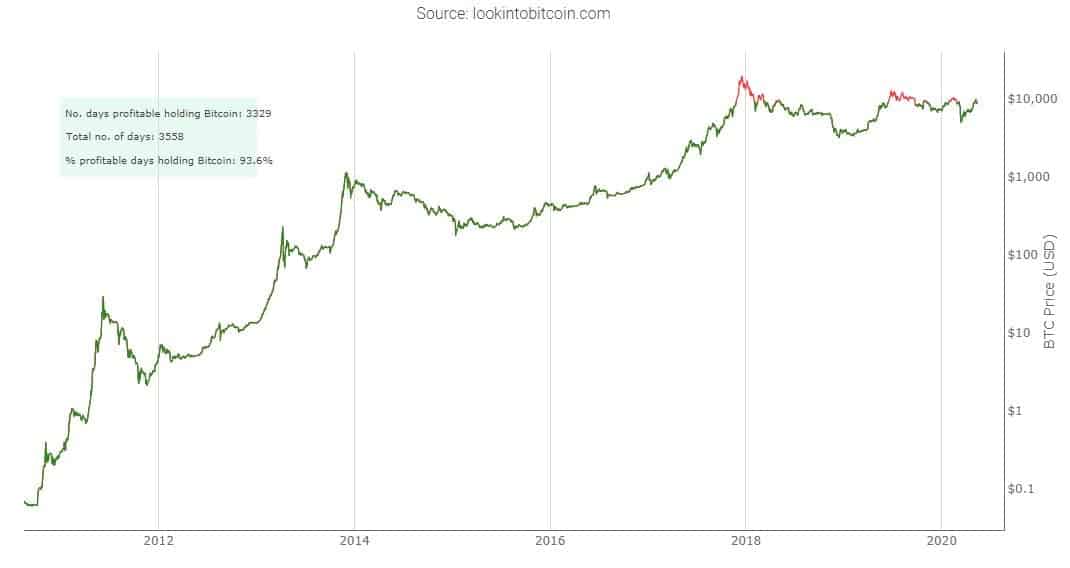
According to a popular cryptocurrency monitoring resource, with the price being where it is now, the number of profitable days holding BTC increased to 93.6% since August 2010. This means that Bitcoin has been in the green in 3329 out of 3558 days.
HODLers Are Not Selling
Another compelling chart examines the behavior of Bitcoin HODLers. More specifically, it looks at the number of BTC addresses that have not moved their coins for one or more years.
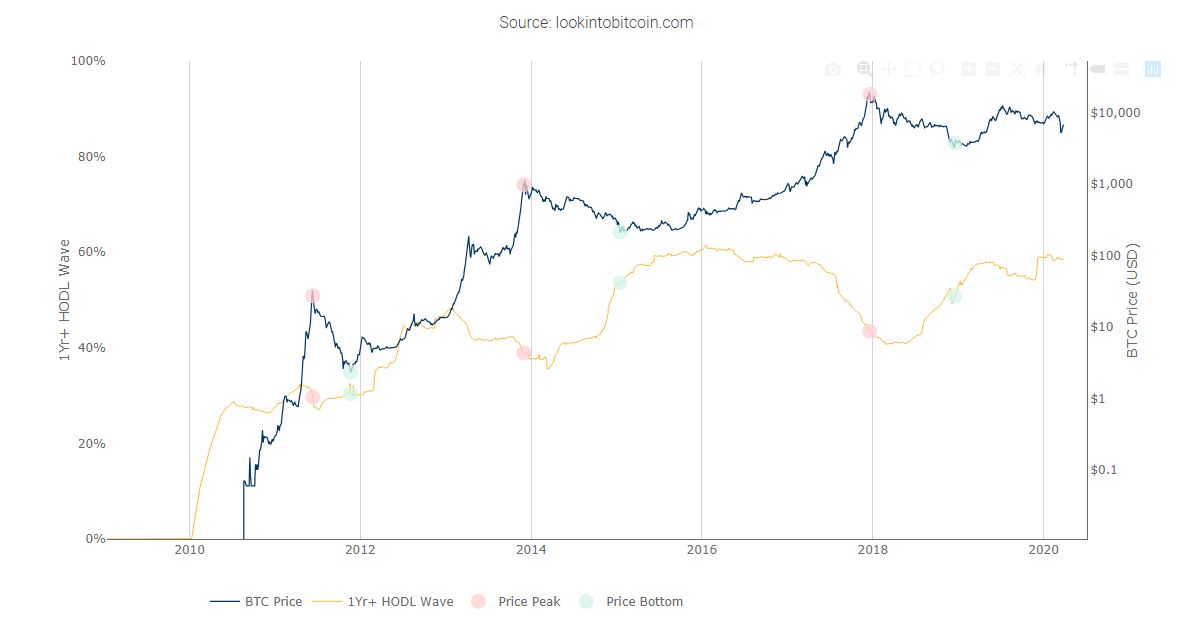
As seen in the above chart, the so-called “one-year HODL wave” is nearly at its all-time high. The last registered data was at 58%, while in January 2016, months before the second halving, the percentage was at 61.
As CryptoPotato reported recently, the BTC daily transfer volume dropped to a 15-month low, showing that HODLers preferred keeping their bitcoins.
Additionally, the chart also relates the price movements with the HODL wave. Starting from the early days in 2011, when BTC peaked at over $30, the wave percentage declined, meaning that HODLers were selling more. A few months later, however, when BTC bottomed at $2,50, the HODL wave percentage increased.
The same is valid for a few other distinctive occasions. Firstly, it happened during the late 2013 bull run and the following price dive. Then, a similar outtake was noted during the parabolic price increase of 2017/2018. When BTC reached its all-time high of $20,000, the one-year HODL wave dropped to about 40%. When the price bottomed in the months after, the wave popped back up to above 55%.