- Cardano price analysis shows price dropped more than 5 hours during the last 24 hours
- Price failed to recover from January 24 decline and could go back to that level
- Trading volume fell 10 percent and ADA market cap dropped 5 percent
Cardano price analysis remained severely bearish today, as price shipped another 5 percent to go as low as $0.848 below the support channel. Over the past 24 hours, ADA trading volume dropped more than 10 percent, and market capitalisation lowered by 5 percent. Cardano failed to recover from the severe decline that occurred on January 24 as price lowered to $0.755 and after initial signs that an upturn may form, Sunday’s price action confirmed the bearish state for the token. With sellers dominating the market, the extent of the current downtrend could yet worsen towards December 16 low of $0.75.
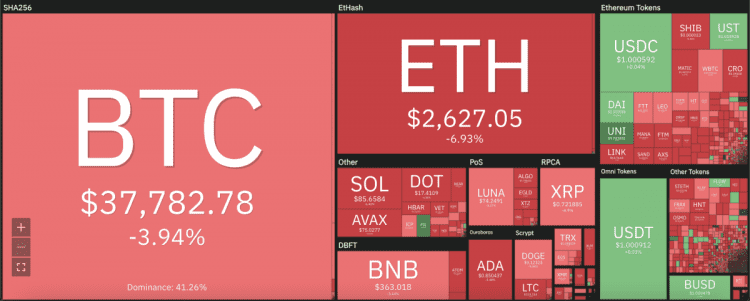
The larger cryptocurrency market also struggled during the day’s trade, as Bitcoin lowered 4 percent to kill prospects of breaching the $38,000 mark. Ethereum also fell 7 percent down to $2,600, and Altcoins showed similar sights. Ripple dropped 5 percent to $0.72, Dogecoin 4 percent to $0.12 and Solana 6 percent to $85.45. Polkadot also dropped 6 percent, along with the Avalanche token that dropped a significant 10 percent.
Cardano price analysis: 24-hour chart shows narrow price range
The 24-hour candlestick chart for Cardano price analysis confirms the token’s declining movement resulting in a narrow price range that the current trend resides in. Since February 24, ADA has not been able to move past the $0.92 resistance and sits well away from it currently as well. The crucial 25-day exponential moving average also lies around the resistance which remains a target for ADA if consolidation can form. However, the low relative strength index (RSI) of 35.41 indicates meagre market valuation, which indicates a continued spell on the sidelines for the token.
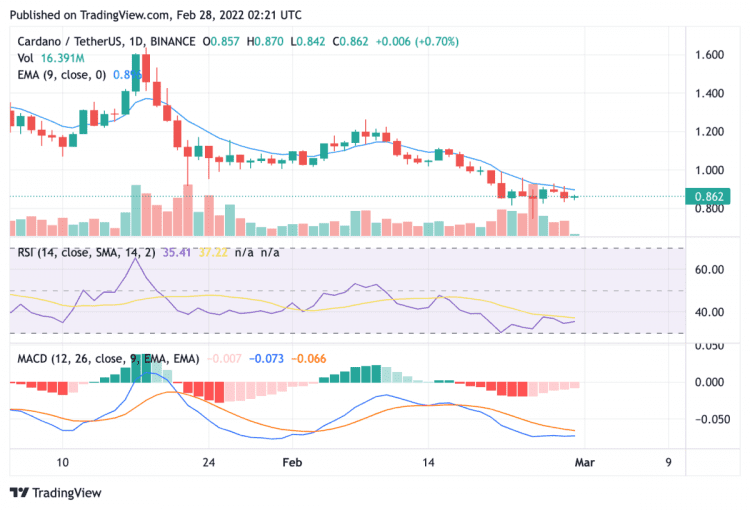
The moving average convergence divergence (MACD) also continues to sit well below its neutral zone, forming bearish highs. Over the next 24 hours, price is expected to remain in the narrow price range of $0.78-$0.89 and is unlikely to test the $0.92 resistance. However, further sell offs could breach the lower cap and move towards the December 24 low of $0.75.
Disclaimer. The information provided is not trading advice. Cryptopolitan.com holds no liability for any investments made based on the information provided on this page. We strongly recommend independent research and/or consultation with a qualified professional before making any investment decisions.