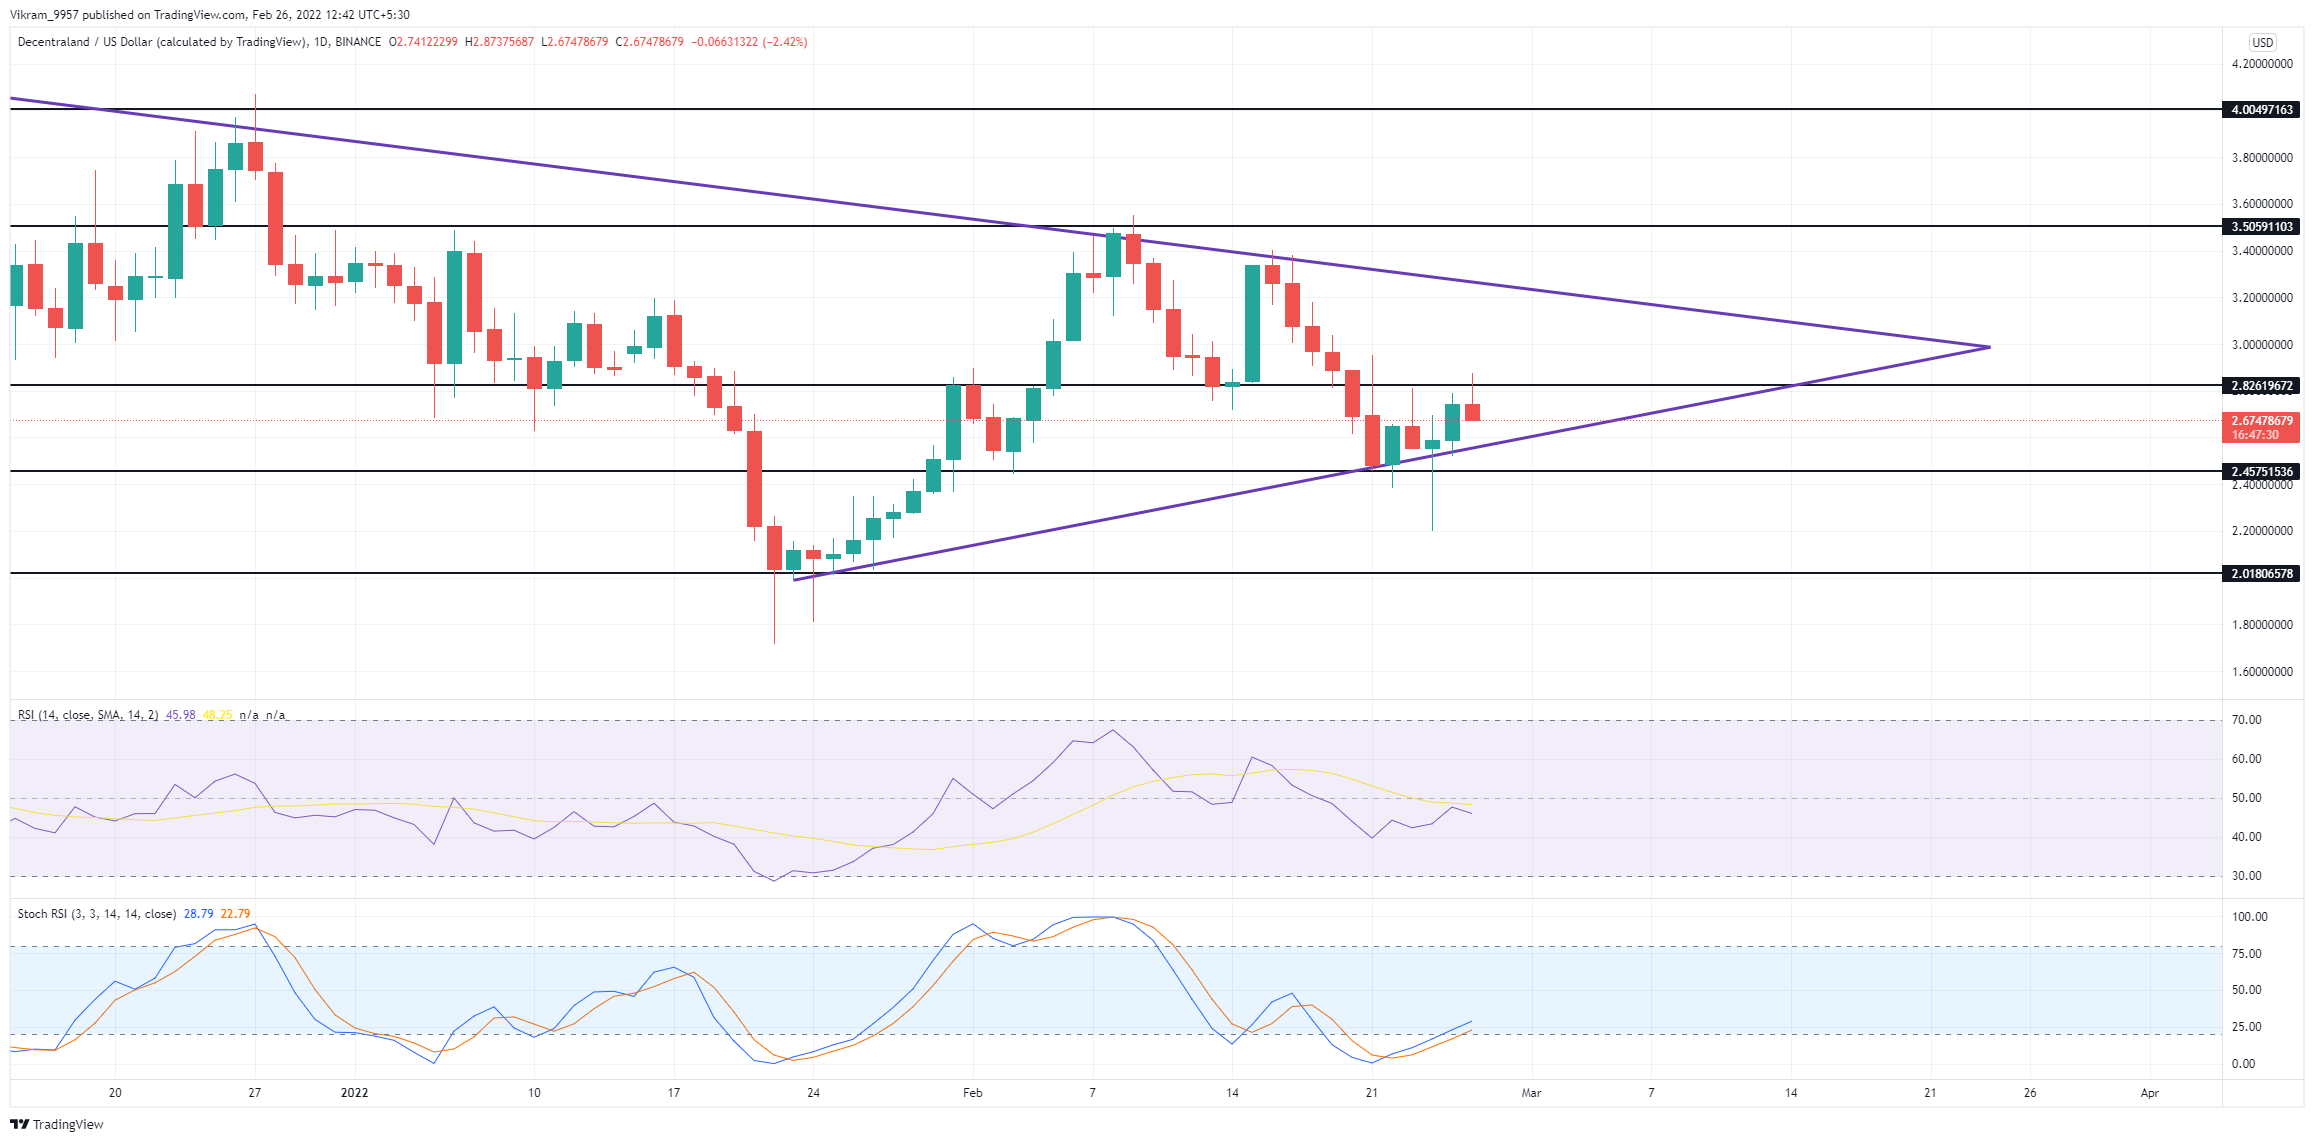
MANA coin price shows a bullish reversal from $2.45 and creates a symmetrical triangle pattern as the rally approaches the long-coming resistance trendline. The MANA coin price shows lower price rejection from the $2.5 mark, resulting in a support trendline and a symmetrical triangle pattern. However, the bull cycle struggles to outshine the sellers at $2.85, which questions the possibility of a bullish rally approaching the resistance trendline?
Key technical points:
- MANA price action creates a morning star pattern
- The Stochastic RSI shows a bullish crossover in the daily chart
- The 24-hour trading volume in the MANA token is $1.02 Billion, indicating a 30% fall.
Past Performance of MANA
With the recent rejection from the long-coming resistance trendline, the MANA coin price retraces 25% to the $2.5 mark. However, the bulls resurface to hold the $2.5 level and bring a short reversal. This generates a weak support trendline that completes a symmetrical triangle pattern in the daily chart.  Source-Tradingview
MANA Technical Analysis
The MANA coin price shows a bullish reversal within a triangle pattern but struggles to overcome the $2.85 barrier. Hence, a selling opportunity with the breakout of support trendline is possible. The MANA price shows a higher price rejection from the 50-day EMA and falls below the 100-day EMA. Hence, a retracement to the 200-day EMA is possible, which will break below the support trendline. After the bullish crossover in the oversold territory, the Stochastic RSI indicator shows sharp linear growth in the K and D lines. However, the lines must overcome the previous failed bullish cycle peak to generate a bullish signal. The RSI Indicator slope shows a gradual rise that struggles to surpass the halfway mark after the sharp fall from the overbought zone. Moreover, the RSI slope fails to reach the 14-day average. In short, the MANA technical analysis shows a weak bullish reversal that may shortly break below the support trendline.
Upcoming Trend
The MANA coin price struggles to surpass the $2.85 mark and fails to withstand the selling pressure resulting in the long wick formation. Hence, the bears are resurfacing after the 5.83% overnight growth. That is why sellers can shortly find a trendline breakout entry with the target of $2.40. Support Levels: $2.50 and $2.40 Resistance Levels: $2.85 and $3
 cryptoknowmics.com