- Litecoin price analysis shows a bearish trend today
- Litecoin’s current price is 104.37
- Resistance has been tested at $110.1 but strong support lies at $100
Litecoin opened today’s daily chart with an increase of 5.69 percent, a bullish momentum. Litecoin price analysis in the last week has retraced to the $100 level. However, things turned bearish soon after as the prices dropped.
This week, Litecoin price analysis opened at the $95 level which is quickly closed with a 7 percent increase in just days. The current trend is still bearish and this week’s Litecoin news analysis may see LTC/USD testing the resistance at $150.The current resistance of Litecoin is at $108.03, a bullish trend line.
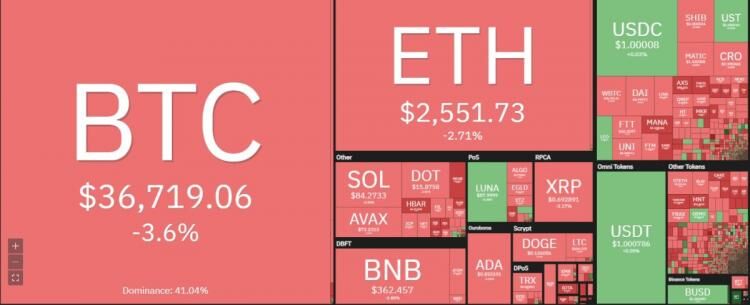
The LTC/USD price is $104.37 with a market cap of $6.8 billion and a 24-hour volume of $352 million. Litecoin has traded in a close range of $101.87-$108.53, with a market dominance of 0.44 percent and ranking position 20 overall. Litecoin trading volume has however decreased by 24.90 percent a total of $810,178,855.19.
Litecoin price action in the last 24 hours: Bulls are awaiting as LTC leans onto support level
LTC/USD price analysis indicates Litecoin is trading in a range of $104-$108 after opening today’s daily chart with an increase of 5.69 percent. Litecoin entered the week at $85 level and opened this morning at $93.94, after closed yesterday’s daily candle at $101.90.The Oscillators are indicating an uptrend movement and this may see Litecoin retesting the $150 resistance mark.
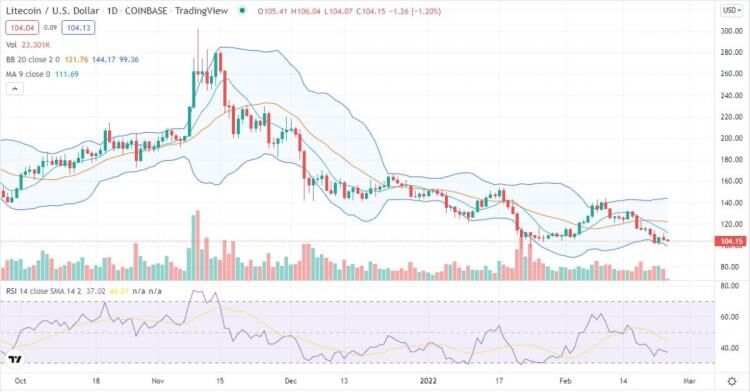
The Relative Strength Index oscillator is in the 50 region with a value of 51.63 and the MACD indicator has crossed over to the Bullish region and is expected to rise before testing the $150 resistance mark. Looking at the upper Bollinger band is moving towards the $109. Additionally, Bollinger bands are stretching indicating high volatility.
LTC/USD 4-hour price analysis: Bulls hold on to the slight upward movement
The 4-hour price action indicates a significant bullish trend established by the bulls. On the technical indicators, signs of the continued bullish trend indicate the next resistance is at $110.The RSI oscillator is in the 50 regions in the 51.16 mark and 38.2,3 is the 100 SMA while the 200 SMA is located at $109.65 indicating that LTC/USD price will continue its bullish momentum as long as it trades above these regions
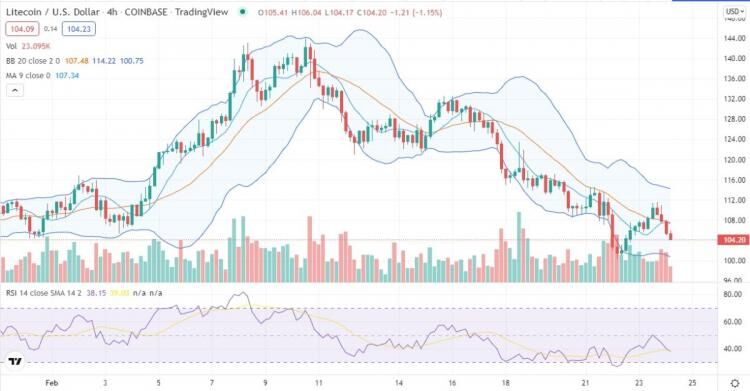
The MACD line has crossed over to the Bullish zone and is expected to rise before testing the $110 resistance regions. The Stochastic Oscillators period 14 has crossed range 80 over range 20 at $108 showing the firm bullish trend. The RSI is oscillating between the 50 and 20 regions with a value of 51.16, it is bullish as long as the RSI oscillator is above 40. Further Litecoin price analysis shows that the Bollinger bands are stretching indicating high volatility in the market.
Litecoin price analysis conclusion
Today’s Litecoin price analysis shows bullish momentum. We can summarize that Litecoin will continue to rise as long as it continues with the current bullish trend. It indicates that there are high chances of Litecoin’s price continuing its bullish trend before testing the psychological level of $150.
Disclaimer. The information provided is not trading advice. Cryptopolitan.com holds no liability for any investments made based on the information provided on this page. We strongly recommend independent research and/or consultation with a qualified professional before making any investment decisions.