The 40% downfall in the last week brings the KDA coin price below $6. However, the recent consolidation halts the downfall, will it reverse the trend? Kadena is a blockchain that is publicly designed to maximize scaling and has a brand novel smart contract language called Pact. It comes with formal validation and upgrades to smart contracts. KDA also utilizes a brand new Proof-of-Work (PoW) system of consensus known as Chainweb. It is made up of several individual chains working in tandem to perform transactions on the network. Let us move ahead to read about Kadena's technical analysis.
Past Performance of KDA
KDA coin price fails to sustain above the crucial support level of $9 resulting in the downfall of more than 40% in the past week. However, the downfall dilutes into consolidation between $4.75 and $5.75. The short-term consolidation seems to be a retest of $6 fallout. Therefore, traders need to avoid taking a bullish entry till a range breakout. 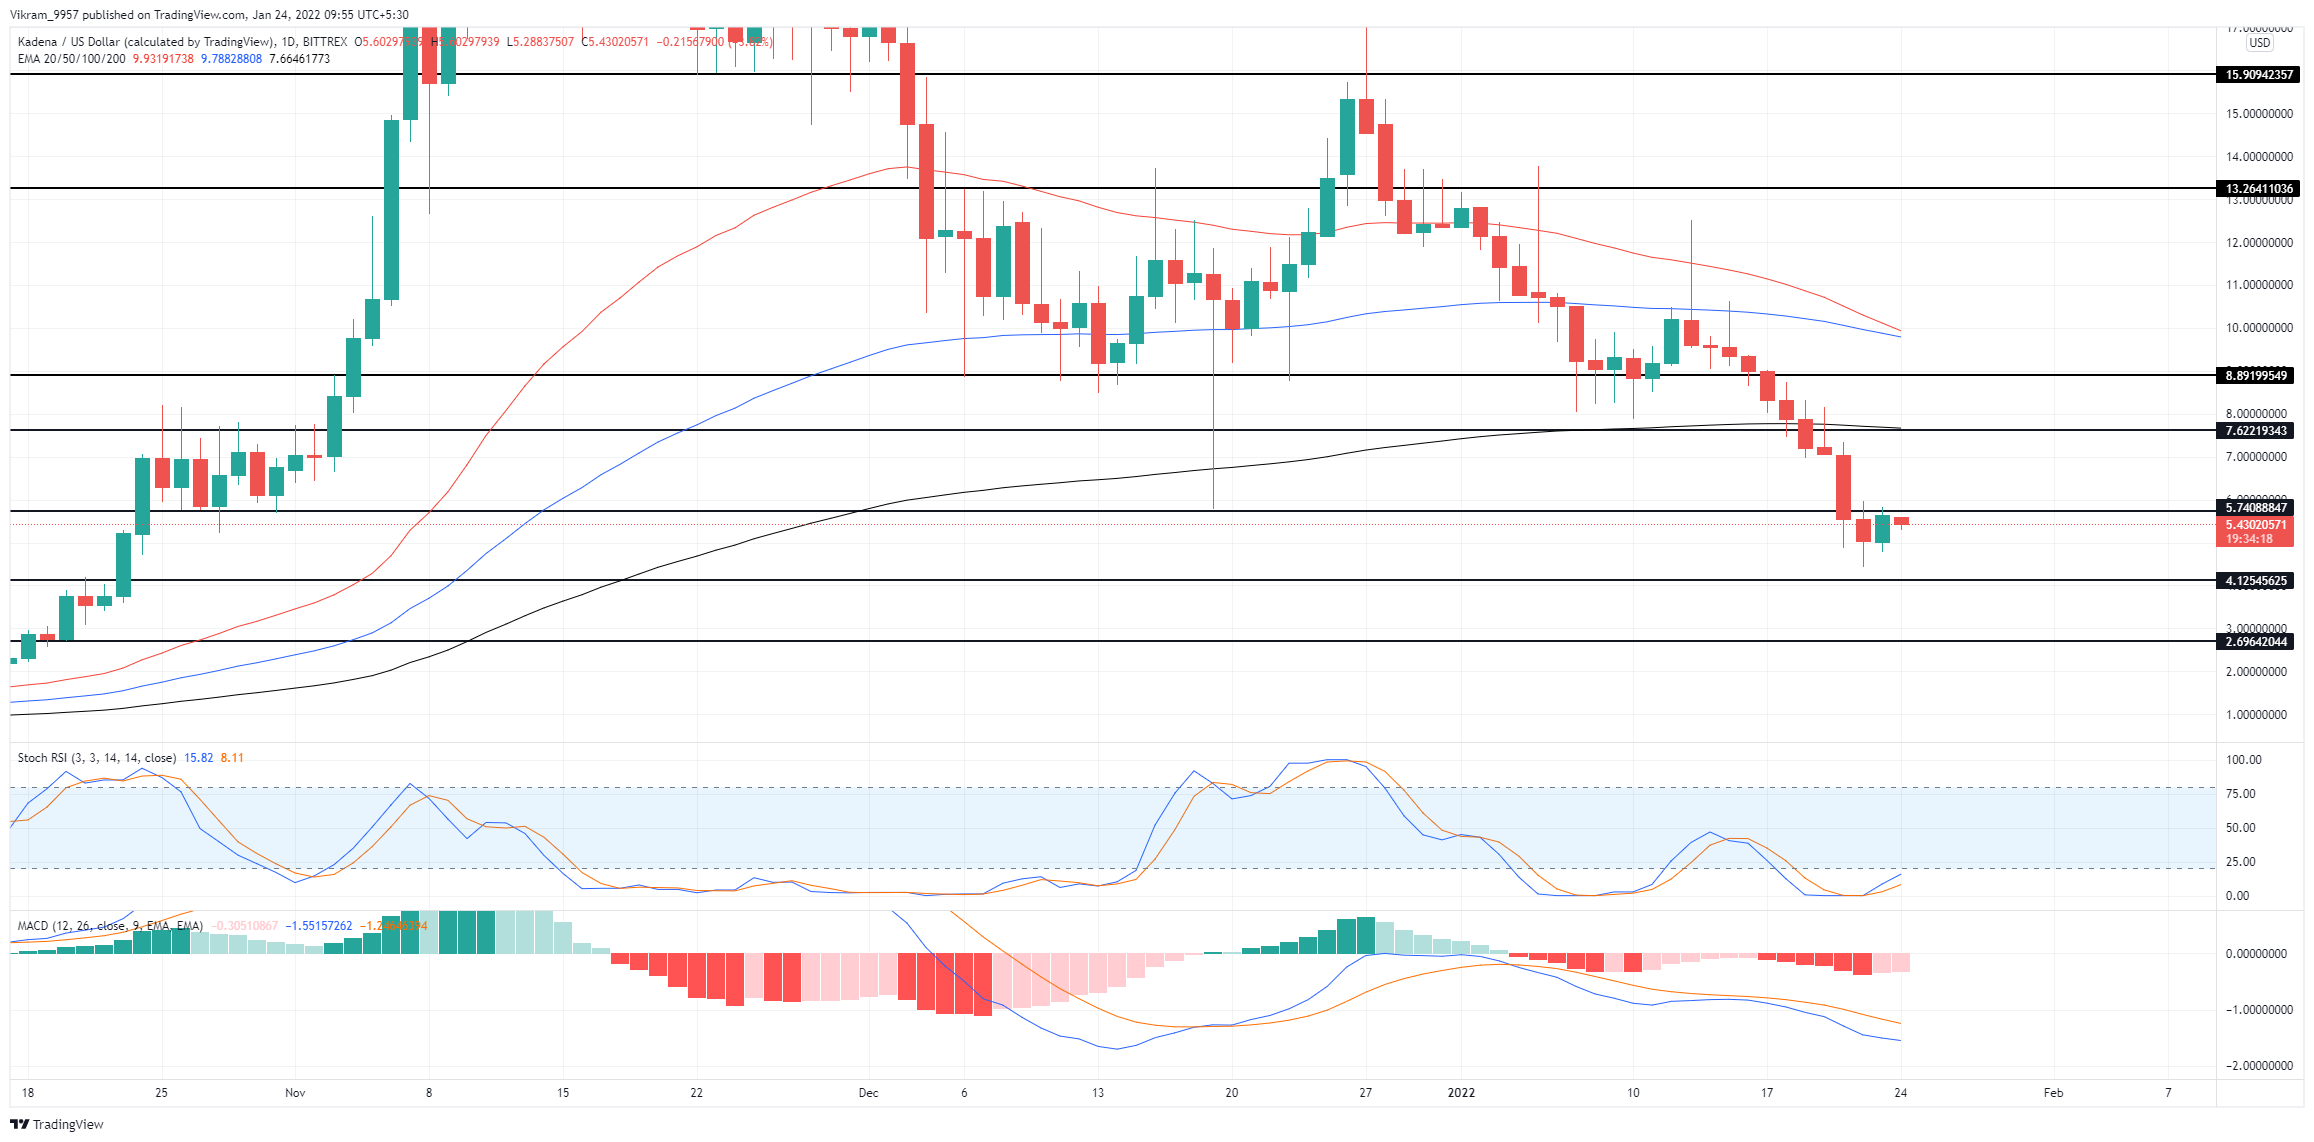 KDA/USD Daily Chart
KDA Technical Analysis
The recent bullish engulfing in the KDA coin price brings a 10% growth in the past 24 hours. However, Kadena struggles to overcome the selling pressure at $5.75 despite the presence of lower price rejection. The falling Crucial 50 and 100-day Exponential Moving Averages in the daily chart are on the verge of giving a bearish crossover. Moreover, the recent price jump might retest the breakout of the 200-day EMA. The Stochastic RSI Indicator reflects a rise in buying pressure evident by the bullish crossover of the K and D lines. Therefore, the indicator supports the bullish breakout of $5.75. The MACD Indicator shows the MACD and signal lines falling below the zero line with increasing distance between them. Therefore, the indicator reflects a strong bearish in action. Therefore, the technical indicators showcase an ongoing bearish trend in Kadena with a weak possibility of a trend reversal.
Upcoming Trend
The jump in KDA coin price might result in the breakout of the freshly formed accumulation range. However, the post-breakout rally might retest the breakout of the 200-day EMA. Therefore, the breakout rally strength is still in question due to the boom observed in selling pressure. The Kadena price action indicates solid resistance levels at $7.5, which coincides with the 200-day EMA, and $9. The support levels are at $4 and $2.75. At press time, TradingView Technical Analysis gives a "SELL" signal for the KDA coin.