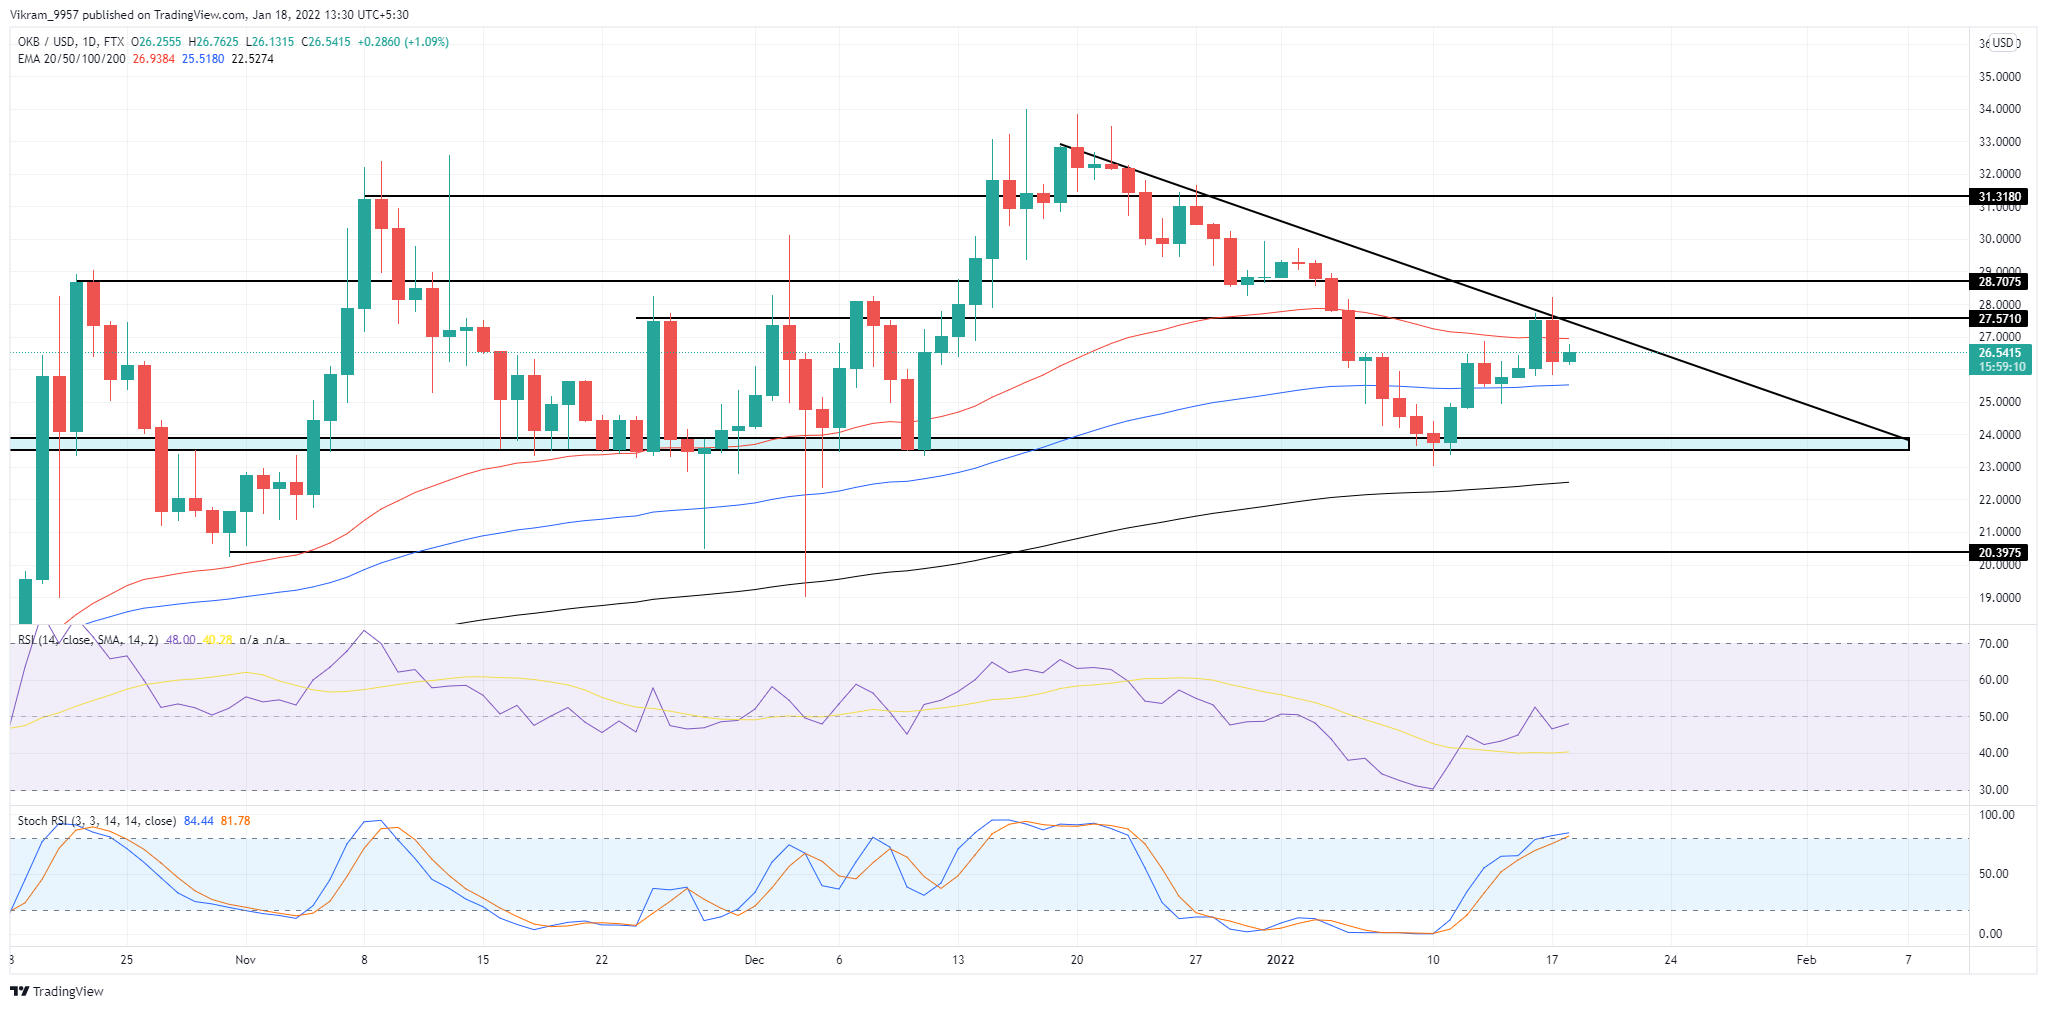
OKB coin price action forms a descending triangle pattern with the newly formed resistance trendline. Will the bulls manage to break above this pattern? OKB is a cryptocurrency that was created through the OK Blockchain Foundation and Maltese cryptocurrency exchange, OKEx. The exchange is among the biggest in the world and currently is third in terms of liquidity, fourth in terms of trading volume, and has a broad range in trading pairs. OKEx is very similar to the giant cryptocurrency exchange Binance in many ways, however, there are some key distinctions. The platform offers its own cloud mining services, and the company is more focused on offering options trading services to customers. Let us move ahead to read about OKB technical analysis.
Past Performance of OKB
The OKB coin price struggles to rise above the horizontal level at $27.5 resulting in the downfall of 4.60% in the past 24 hours. Nonetheless, the price action shows an 11% jump in the last week from the support zone at $24. However, the tweezer top formation hints at a downfall back to the support zone.  OKB/USD Daily Chart
OKB Technical Analysis
The OKB coin price action shows the formation of a resistance trendline in the daily chart. The trendline creates the image of a descending triangle pattern with the base at $24. Crucial EMAs (50, 100, and 200) rise higher in a bullish alignment in the daily chart. However, the price breaks below the 50-day EMA and finds support at the 100-day EMA. Meanwhile, the 200-day EMA stands strong beneath the triangle pattern. The RSI indicator at 48% shows the slope moving in a zig-zag movement near the central line in the daily chart. The slope reapproaches the central line as the 14-day SMA shows a gradual reversal. The Stochastic RSI indicator reflects a high possibility of a bearish crossover between the K and D in the daily chart. Therefore, a bearish retracement within the triangle is plausible. Taking a bearish stand, the technical analysis shows a rise in selling pressure and forecasts a reversal within the triangle.
Upcoming Trend
The OKB coin price action plans to resonate within the triangle pattern before giving a crucial breakout and setting the upcoming trend. However, the recent bearish retracement brings a shorting opportunity with a target near $24. However, safe traders should be patient till the pattern breakout to avoid sudden reversal within the triangle. The OKB coin price chart suggests a bullish breakout of the triangle can face opposition at $28 and $31. And, if the bears control the upcoming trend, prices can find support at 200-day EMA and $20. At press time, the technical analysis by TradingView projects "NEUTRAL" sentiments for the OKB coin.
 cryptoknowmics.com