UNI coin price approaches the resistance trendline of the falling broadening wedge pattern. Can bulls break it this time? Uniswap is a famous decentralized buying and selling protocol, acknowledged for its position in facilitating the computerized buying and selling of decentralized finance (DeFi) tokens. Its objectives are to preserve token buying and selling computerized and absolutely open to anybody who holds tokens. At the same time, enhances the performance of buying and selling as opposed to that on conventional exchanges. The exchange creates greater performance via means of fixing liquidity troubles with computerized solutions, fending off the issues which plagued the primary decentralized exchanges. Let us move ahead to read about Uniswap technical analysis.
Past Performance of UNI
The UNI coin price action shows a bullish reversal from the horizontal level of $14 resulting in a price jump of more than 20%. The price jumps breaks above the $16 zone and approaches the resistance trendline. However, the bearish candle forming near the trendline hints at a bearish reversal. 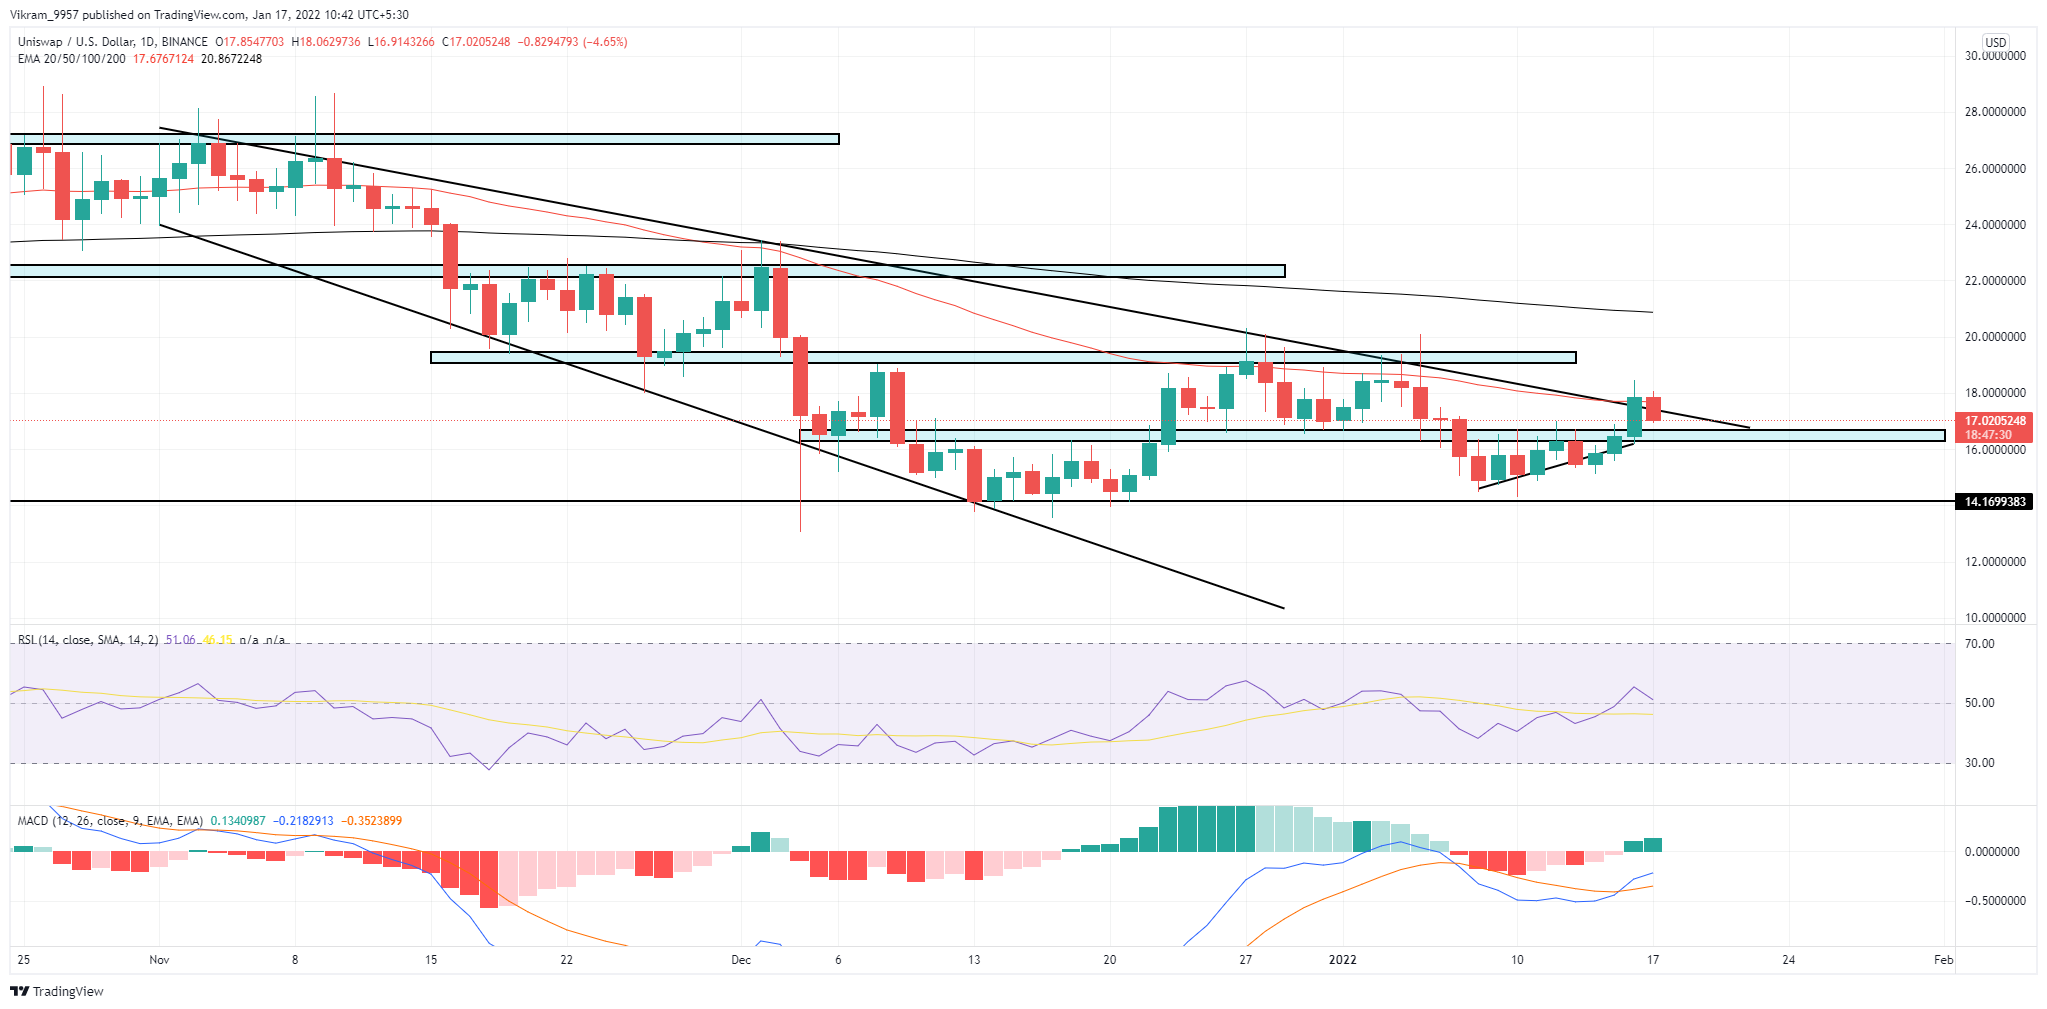 UNI/USD Daily Chart
UNI Technical Analysis
The UNI coin price approaches the resistance of the falling wedge pattern in the daily chart. However, the high selling pressure near the trendline seems to suppress the short-term bullish rally. Crucial EMAs (50, 100, and 200) trend lower in a bearish alignment in the daily chart. The price faces dynamic resistance near the 50-day EMA, resulting in the bearish candle at press time. The RSI indicator at 51% shows a sudden decrease in the slope resulting in a fall towards the central line (50%) in the daily chart. Therefore, the indicator reflects a sudden fall in the underlying bullish momentum. The MACD indicator shows a rising movement in the MACD line after the bullish crossover with the signal line. Therefore, the indicator remains bullish for the coin. Therefore, the UNI coin price action and technical indicators wait for the breakout of the trendline or the $16 zone to give a decisive signal.
Upcoming Trend
The UNI coin price struggles to rise above the high selling pressure area, moving along with the resistance trendline and the 50-day EMA. However, the $16 support zone stands strong and attempts to push the price higher. Therefore, traders need to wait for the price action confirmation before picking a side. The price action suggests upcoming resistance levels at $19 and $22 following the resistance trendline. And, in case of a bearish reversal, the price can find support at $16 and $14. At the time of writing, the sentiment chart gives a "BUY" signal for the UNI token.