- Shiba Inu price analysis is bearish today.
- The strongest resistance is present at $0.00003542.
- Shiba Inu currently trades for $0.00002928.
The Shiba Inu price analysis has entered a bearish domain today, reversing the previous trend of the market. The bulls dominated the market for a few days, but the bears found an opening and took full advantage of it; all that’s left to see it will this momentum be maintained. Following yesterday’s movement, the price of SHIB held itself and reached $0.00003058, from $0.00003013. On January 16, 2022, the price fluctuated around the $0.00003050 mark and remained around that threshold.
Today, on January 17, 2022, the price has experienced a flash crash, and the price has dropped to $0.00002928 while losing a significant amount of its original value. SHIB currently trades at $0.00002928. Shiba Inu has been down 4.10% in the last 24 hours, with a trading volume of $634,080,490.
SHIB/USD 4-hour analysis: Support breaks
The Shiba Inu price analysis has revealed the market seems to have reversed and entered a bearish region with the volatility following an inclining movement, making the cryptocurrency’s price more vulnerable to change on either extreme. Consequently, the upper limit of the Bollinger’s band is present at $0.00003181, which acts as the strongest resistance for SHIB. Conversely, the lower limit of the Bollinger’s band is available at $0.00002949, which acts as another resistance point rather than the support for SHIB.
The support and resistance band appears to be moving away from each other, indicating the market volatility is expanding. The SHIB price seems to break the support, which causes a breakout in the market and establishes a new resistance for the cryptocurrency. Although the breakout indicates a probable reversal bound to happen in the market sooner or later, we can still have hope for SHIB.
The SHIB/USD price appears to be crossing under the Moving Average curve, making the market bearish. The price has entered the bearish zone with no telling whether the bears will be able to carry on with it. In the last few hours, the Shiba Inu market has experienced fluctuations between bearish and bullish trends. It has finally decided on entering the bear’s territory. As the volatility increases, the market becomes more vulnerable to shifting in any direction.
The market is also experiencing a breakout which is a potential sign for the cryptocurrency to switch up and regain lost momentum.
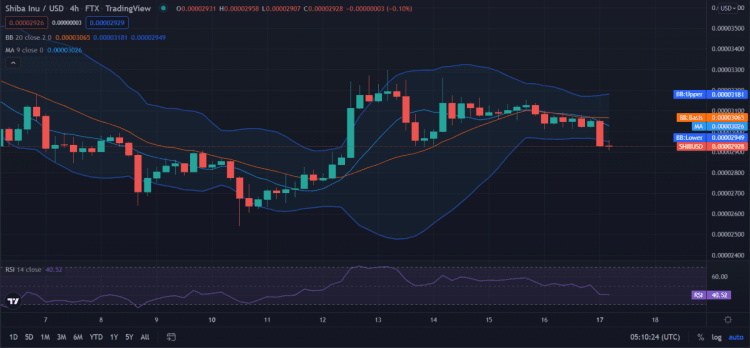
The Relative Strength Index (RSI) score is 40, making the cryptocurrency fall in the lower neutral zone, showing no signs of devaluation or inflation. However, the buying activity has equaled the selling activity causing the RSI score to remain constant.
Shiba Inu Price Analysis for 1-day: The squeeze tightens
The Shiba Inu price analysis has revealed a bearish market with the potential to maintain it. Moreover, the market’s volatility appears to be following a declining trend, making Shiba Inu’s price less vulnerable to variable change on either extreme. As a result, the upper limit of the Bollinger’s band is present at $0.00003542, which serves as the strongest resistance for SHIB. Conversely, the lower limit of the Bollinger’s band exists at $0.00002633, which acts as the strongest support for SHIB.
The SHIB/USD price appears to cross under the curve of the Moving Average, signifying a bearish movement. The market seems to follow a clear trend, with the volatility declining, allowing bears a massive chance to maintain their control on the market. However, the support and resistance bands appear to be filling the gap between them, tightening the market, indicating a tight market with fewer chances of volatile change.
The market has just recently entered the bearish domain, which might cause problems for the bulls as the odds stacked against them, the bulls lose their chances of reaching higher highs.
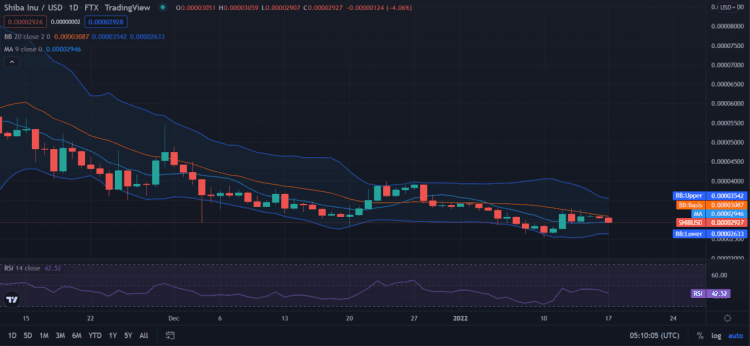
The Shiba Inu price analysis reveals the Relative Strength Index (RSI) score to be 42, signifying the devaluation of the cryptocurrency. Furthermore, the RSI falls in the lower neutral zone, following a declining trend. This represents the intense selling activity outweighing the buying activity, causing the RSI score to decline.
Shiba Inu Price Analysis Conclusion:
The Shiba Inu price analysis concludes that the cryptocurrency follows a bearish trend. The cryptocurrency lost all bullish potential while the bears stormed the market. The volatility declines as bears come and snatch the market from the bulls.
Disclaimer. The information provided is not trading advice. Cryptopolitan.com holds no liability for any investments made based on the information provided on this page. We strongly recommend independent research and/or consultation with a qualified professional before making any investment decisions.