- Terra price analysis is bearish today.
- LUNA/USD is currently trading at $87.5
- Price could be in line for $72 support floor
Terra price analysis markets currently show a price of $87.5 for LUNA/USD, according to Coinmarketcap.com. The price has touched a high of $87 and is in line with the outlined bullish pattern. In the past 5 trading days, Luna was one of many altcoins deeply affected by market dynamics linked to a general market decline. The price fell to $62 and has since rebounded. However, the rebound quickly amplified and is now in line with the overarching bullish sentiment.
LUNA/USD price movement in the last 24 hours: High volatility crushing hopes
The Bollinger bands are wide on the daily chart, with prices coming close to the middle Band. The bands indicate sideways movement for now, so being neutral might be a good plan at this time.
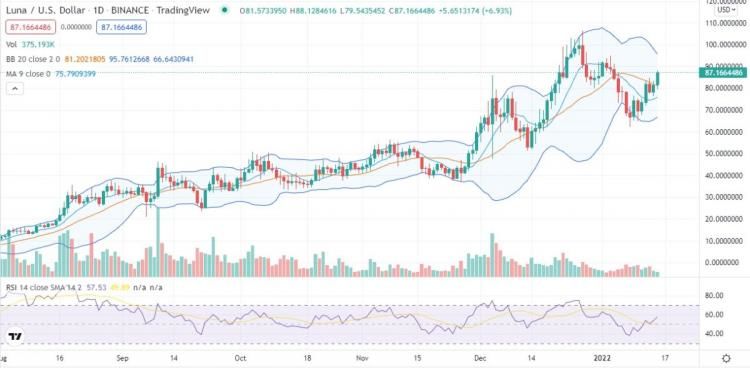
The support floor by technicians is $62, which was established when the price fell from a high of $79.9. The support floor is constantly being tested by Luna, which constantly makes lower highs and higher lows break past it.
Looking closer into technicals, we can see that almost all chart indicators reflect an favorable position for Luna. If we look closely, we can see a slight bullish divergence on MACD, reflecting a short-term bounce. In the 3 day chart, we can see a bullish divergence on RSI, which means that while the price of LUNA has been going down, sentiment around it has been a little bit more optimistic than expected. This also means that there is a possibility of seeing the price rise in the next few days. If these indicators do not hold and Luna drops to lower lows, it might be time to abandon all hope since this would indicate an uptrend reversal or further losses in the worst-case scenario.
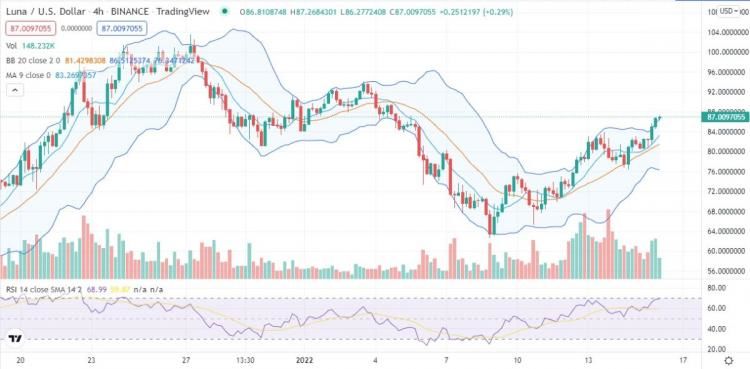
LUNA/USD 4-hour price analysis chart: LUNA/USD in bullish overtone
Terra price analysis: 24-hour chart. Source: Trading View
The two MA’s are also the same width, the 20 day EMA crosses over the 50 day EMA, which indicates that the price could head back to somewhere in between. The RSI is also on a bearish run and looks like it will only continue as the price drops.
We do not have overly good news for those looking to invest in LUNA as of right now. However, investing based on technical analysis is always a risk/reward scenario. Because of this fact, we believe that even if Luna falls from here, those who buy before a fall would ultimately be making a decent return by just holding onto their coins until prices rise again beyond $90.
The RSI oscillator is currently at 49%. It has managed to break through its lowest possible bottom, which indicated bearish momentum but did not do so because of resistance at around the $55 mark. However, if there is no significant bullish movement in price, this might happen soon.
The Oscillator Indicator is in line with what we have been saying for a while now: In the short term, prices are highly volatile and could experience further decline if market sentiments remain bearish.
Terra price analysis: Conclusion
Terra price analysis is bullish for short-term traders; however, investors would have to wait for a bullish price movement before investing. We suggest they invest soon in the latter case because prices might decline further if market sentiments remain bearish in the long run.
Disclaimer. The information provided is not trading advice. Cryptopolitan.com holds no liability for any investments made based on the information provided on this page. We strongly recommend independent research and/or consultation with a qualified professional before making any investment decisions.