- Litecoin price analysis is bullish.
- Support for LTC/USD is present at $144.8.
- Resistance is present at $151.7.
The Litecoin price analysis is bullish as it is showing encouraging signs for the cryptocurrency, as bulls have been able to break past the resistance of $145.9. The price levels are rising slowly, and they are expected to cross the $150 psychological mark as the price has already reached $148.4. If the bullish momentum intensifies in the next 24-hours, then the resistance at $151.7 can be surpassed as well. However, this resistance is still far above the current price level.
LTC/USD 1-day price chart: Price regains balance at $148.4 after receiving a bullish push
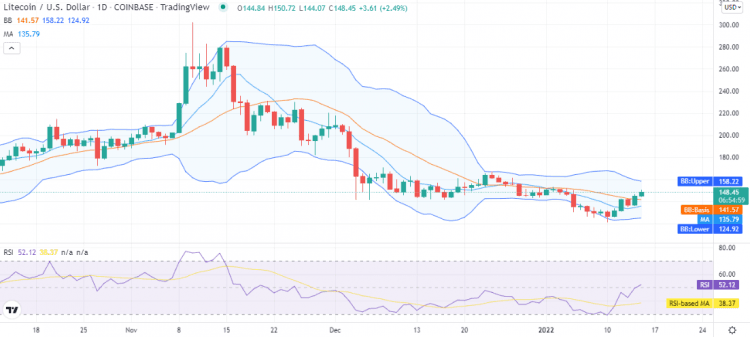
The 1-day price chart for Litecoin price analysis shows cryptocurrency values are going up as bulls are carrying their lead successfully for today. The chart shows that the bulls have tried to make a return in the past few days, and today they have succeeded in taking elevating the price level. The price levels are increasing and have reached up to $148.4, gaining 2.45 percent value during the last 24 hours. The Moving Average (MA) is standing right now at $141, below the current price level.

The Bollinger bands are showing mild volatility for LTC as the upper band has reached $158 and the lower band has reached the value of $124, representing the strongest resistance and support, respectively. The Relative Strength Index ( RSI ) score is on the increasing side as well and has moved up to index 52 in the upper half of the neutral zone.
Litecoin price analysis: Recent developments and further technical indications
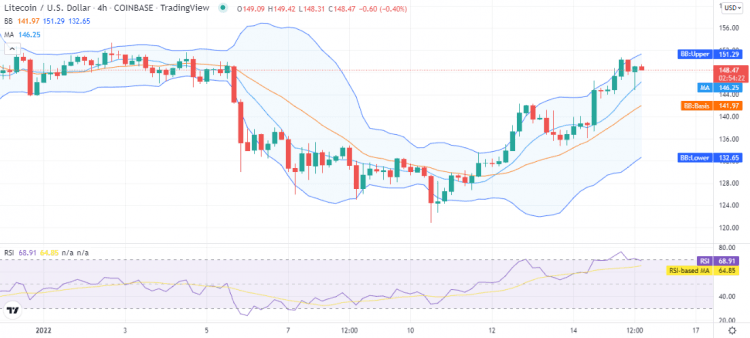
The 4-hours Litecoin price analysis indicates a rise in price as the bullish momentum has been mostly at lean. The past few hours have been highly favorable for the bulls, as the short-term trending line is showing more green candlesticks. However, the price function is currently facing selling pressure as the price function has been downwards for the last four hours.

The price has come down to $148.4 after swinging high towards $150.2, which is just above the upper value of the Bollinger Bands on the 4-hour chart. The volatility is still high, which is a relatively positive sign for cryptocurrency as it will provide a chance for the bulls to return in the coming hours. The RSI has also entered the neutral zone from the overbought zone after the recent selling activity.
Litecoin price analysis conclusion
The above 1-day and 4-hours Litecoin price analysis is predicting a rise in the price levels, as today the market has been supportive for the bulls at large. The price has gradually restored its momentum and has reached near the $150 mark. There is an imminent possibility that the bulls will take the lead again if the pressure from the buyers’ side increases. We expect LTC to break above the $150 psychological mark.
Disclaimer. The information provided is not trading advice. Cryptopolitan.com holds no liability for any investments made based on the information provided on this page. We strongly recommend independent research and/or consultation with a qualified professional before making any investment decisions.
 cryptopolitan.com