- Chainlink price analysis is bearish today.
- Resistance for LINK/USD is present at $26.6.
- Support for cryptocurrency is present at $23.6.
The most recent Chainlink price analysis gives bearish signs for the day as more selling activity has been recorded. The price has been under a bearish shadow for the past few days, as the price trend line has been downwards since 1st January. The bullish activity was also observed during this time, yet today bears have taken the lead again. The red candlestick on the price chart is marking a bearish price movement, and the LINK/USD value has decreased up to the $25.6 mark.
LINK/USD 1-day price chart: Bears are maintaining their lead as the price is down by 3.2 percent
The 1-day Chainlink price analysis is confirming a decreasing trend for the day as the bears have made a comeback in the last 24-hours. The red candlestick is an indication of the rising bearish momentum, and the LINK/USD value is now $25.6 after losing 3.2 percent during the last 24 hours. Further decrease is also possible in the coming days if the bearish efforts remain consistent. The moving average (MA) value for the cryptocurrency is now at $26.2 above the price level, complementing the bearish trend.

The volatility has increased as the Bollinger bands are diverging over more area now. The Bollinger Bands Indicator is dictating the following values for the day; the upper value is at $29, whereas the lower value is at $18. The Relative Strength Index (RSI) score is quite neutral and has down to index 56, but the curve of the indicator is horizontal, which hints at the presence of the bullish elements at the current price level.
Chainlink price analysis: Recent developments and further technical indications
The 4-hour Chainlink price analysis shows the price has been declining for the past few hours, as the overall power of balance is towards the bearish side. The price breakout was upwards at the start of the trading session, and bulls were also observed trying to elevate the price level later, but overall the bears still dominated the price function for the day, as the bearish periods were more damaging. The price has come down near the average of the Bollinger bands, which at $25.6 represents the support for LINK price. Some support may appear in the coming hours as the RSI curve is also hinting at, as despite the bearish trend, the deficit in price is not steep.
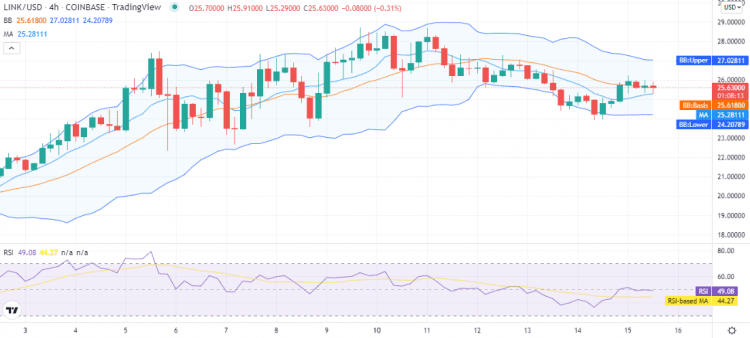
The volatility is mild on the 4-hour chart with the Upper Bollinger band value at $27 representing resistance, whereas the Lower Bollinger band value is at the $24 mark representing support. The MA is trading at the $25.2 mark below the price level.
Chainlink price analysis conclusion
The bears have been ruling the price chart for today, but the downtrend is not strong, and the RSI curve is also hinting at the presence of bullish elements near the current price level. Despite the bearish trend prevailing today, the major trend has to be defined yet. If the support appeared for the coin, then a shift in trend might take place, and if bears gained momentum, then a further decrease in the price level can also be expected.
Disclaimer. The information provided is not trading advice. Cryptopolitan.com holds no liability for any investments made based on the information provided on this page. We strongly recommend independent research and/or consultation with a qualified professional before making any investment decisions.