FTT coin price action gives a bullish breakout of the falling wedge with the growing buying pressure. Should you add more to join the rally?
FTT is the official cryptocurrency token for the platform for trading in crypto derivatives FTX. FTX is supported by Almeda Research, which is acknowledged for being one of the most reputable firms in crypto trading and also one of the biggest liquidity suppliers.
Sam Bankman-Fried is co-founder, chief executive officer, and co-founder of The FTX Cryptocurrency Derivatives Exchange. He also serves as the chief executive officer of Almeda Research and worked as director of development at the Centre for Effective Altruism.
Let us move ahead to read about FTX technical analysis.
Past Performance of FTT
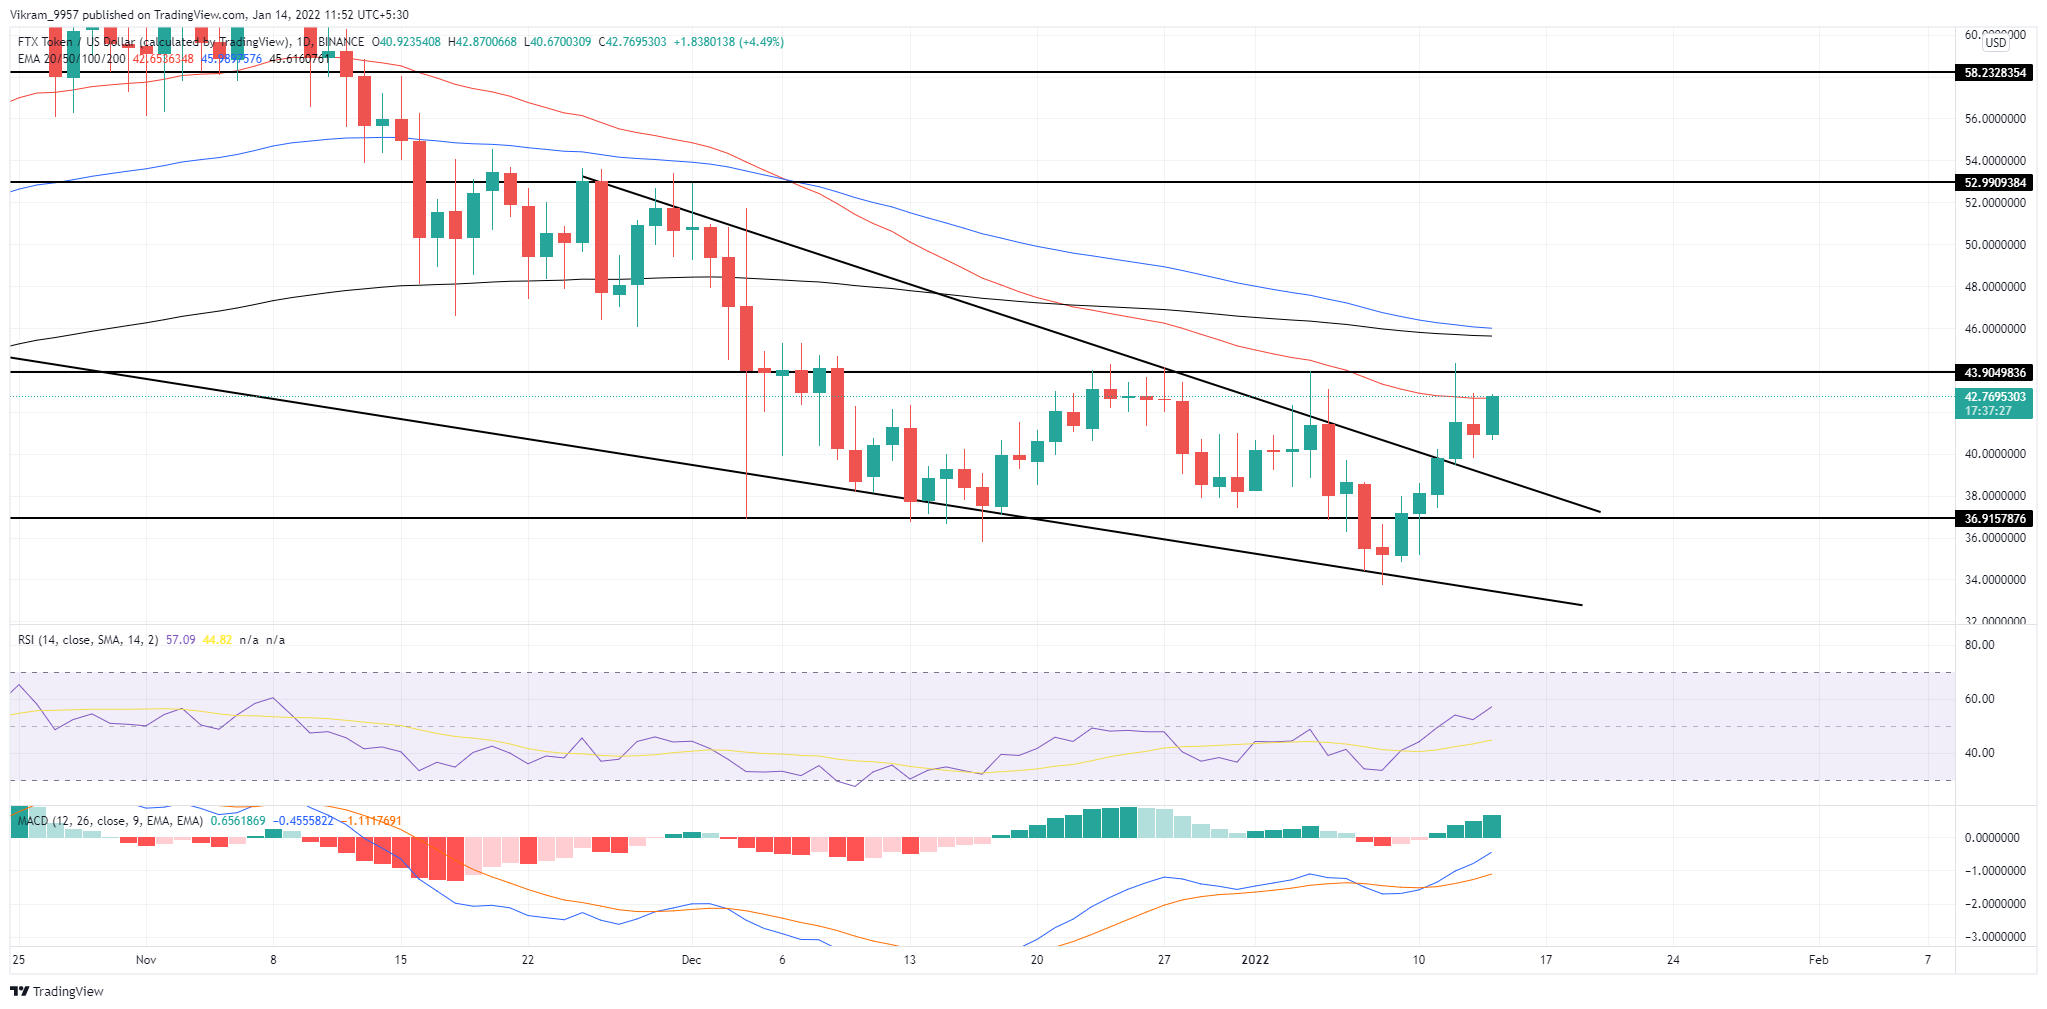
FTT coin price shows a growth of more than 20% in the past week from $35.5 while giving a fake breakout of the horizontal level at $36. The rally breaks above the falling wedge pattern in the daily chart. Moreover, the price jump of 4% today at press time with a 2% jump in trading volume reflects growth in buying pressure.
FTT Technical Analysis
The FTT coin price action shows a rally post-retest of the falling wedge breakout in the daily chart. Moreover, the price seems to shortly break above the horizontal level at $44 which will further increase the bullish attention.
The crucial EMAs (50, 100, and 200) maintain a bearish alignment with the 50-day EMA providing dynamic resistance. However, the growth in FTT coin prices reduces the chances of a bearish crossover of 100 and 200-day EMAs.
The RSI indicator at 67% jumps higher after testing the central line in the daily chart. Additionally, the 14-day SMA maintains an upside growth as it approaches the central line.
The MACD indicator shows the MACD and signal lines rising higher after the bullish crossover in the negative segment in the daily chart. Furthermore, the bearish histograms fail to sustain the trend as bulls regain momentum.
Therefore, the FTT prices show growth of more than 4% today at press time and can shortly overcome selling pressure at the 50-day EMA.
Upcoming Trend
The breakout of the falling wedge pattern showcases a boom in the buying pressure, evident by the increasing trading volume in the FTT coin. Therefore, the upcoming trend after the breakout of $44 seems extensively bullish.
The price action suggests resistance levels at $52 and $58 can oppose the uptrend if the prices overcome the selling at $44 and the EMAs. The high demand levels are at $40 and $36, which can support the falling prices if it fails to rise above the 50-day EMA.
In conclusion, the current rally seems to be solid and can overcome the high selling pressure areas. Therefore, traders can hold or even increase their position size with a stop loss below $40.