- Litecoin increased by a small 7% over the last week of trading as it reached $40.
- The cryptocurrency has been trading within a rising wedge formation for the past 2-weeks.
- Against Bitcoin, Litecoin continues to create fresh lows each day during March.
Key Support & Resistance Levels
LTC/USD:
Support: $39, $35, $32.50.
Resistance: $42, $44, $47.50.
LTC/BTC:
Support: 0.0058 BTC, 0.0056 BTC, 0.0055 BTC.
Resistance: 0.006 BTC, 0.0062 BTC, 0.00634 BTC.
LTC/USD: Litecoin Trading Within Rising Wedge
The daily analysis above shows Litecoin slowly grinding higher in an ascending wedge formation since finding support at the $30 level after the recent market collapse. The cryptocurrency had dipped lower but managed to find support at $24.85 before quickly rising back above $30.
The cryptocurrency was struggling at $39 for the past week of trading but recently managed to rise above here and is now using it as support.
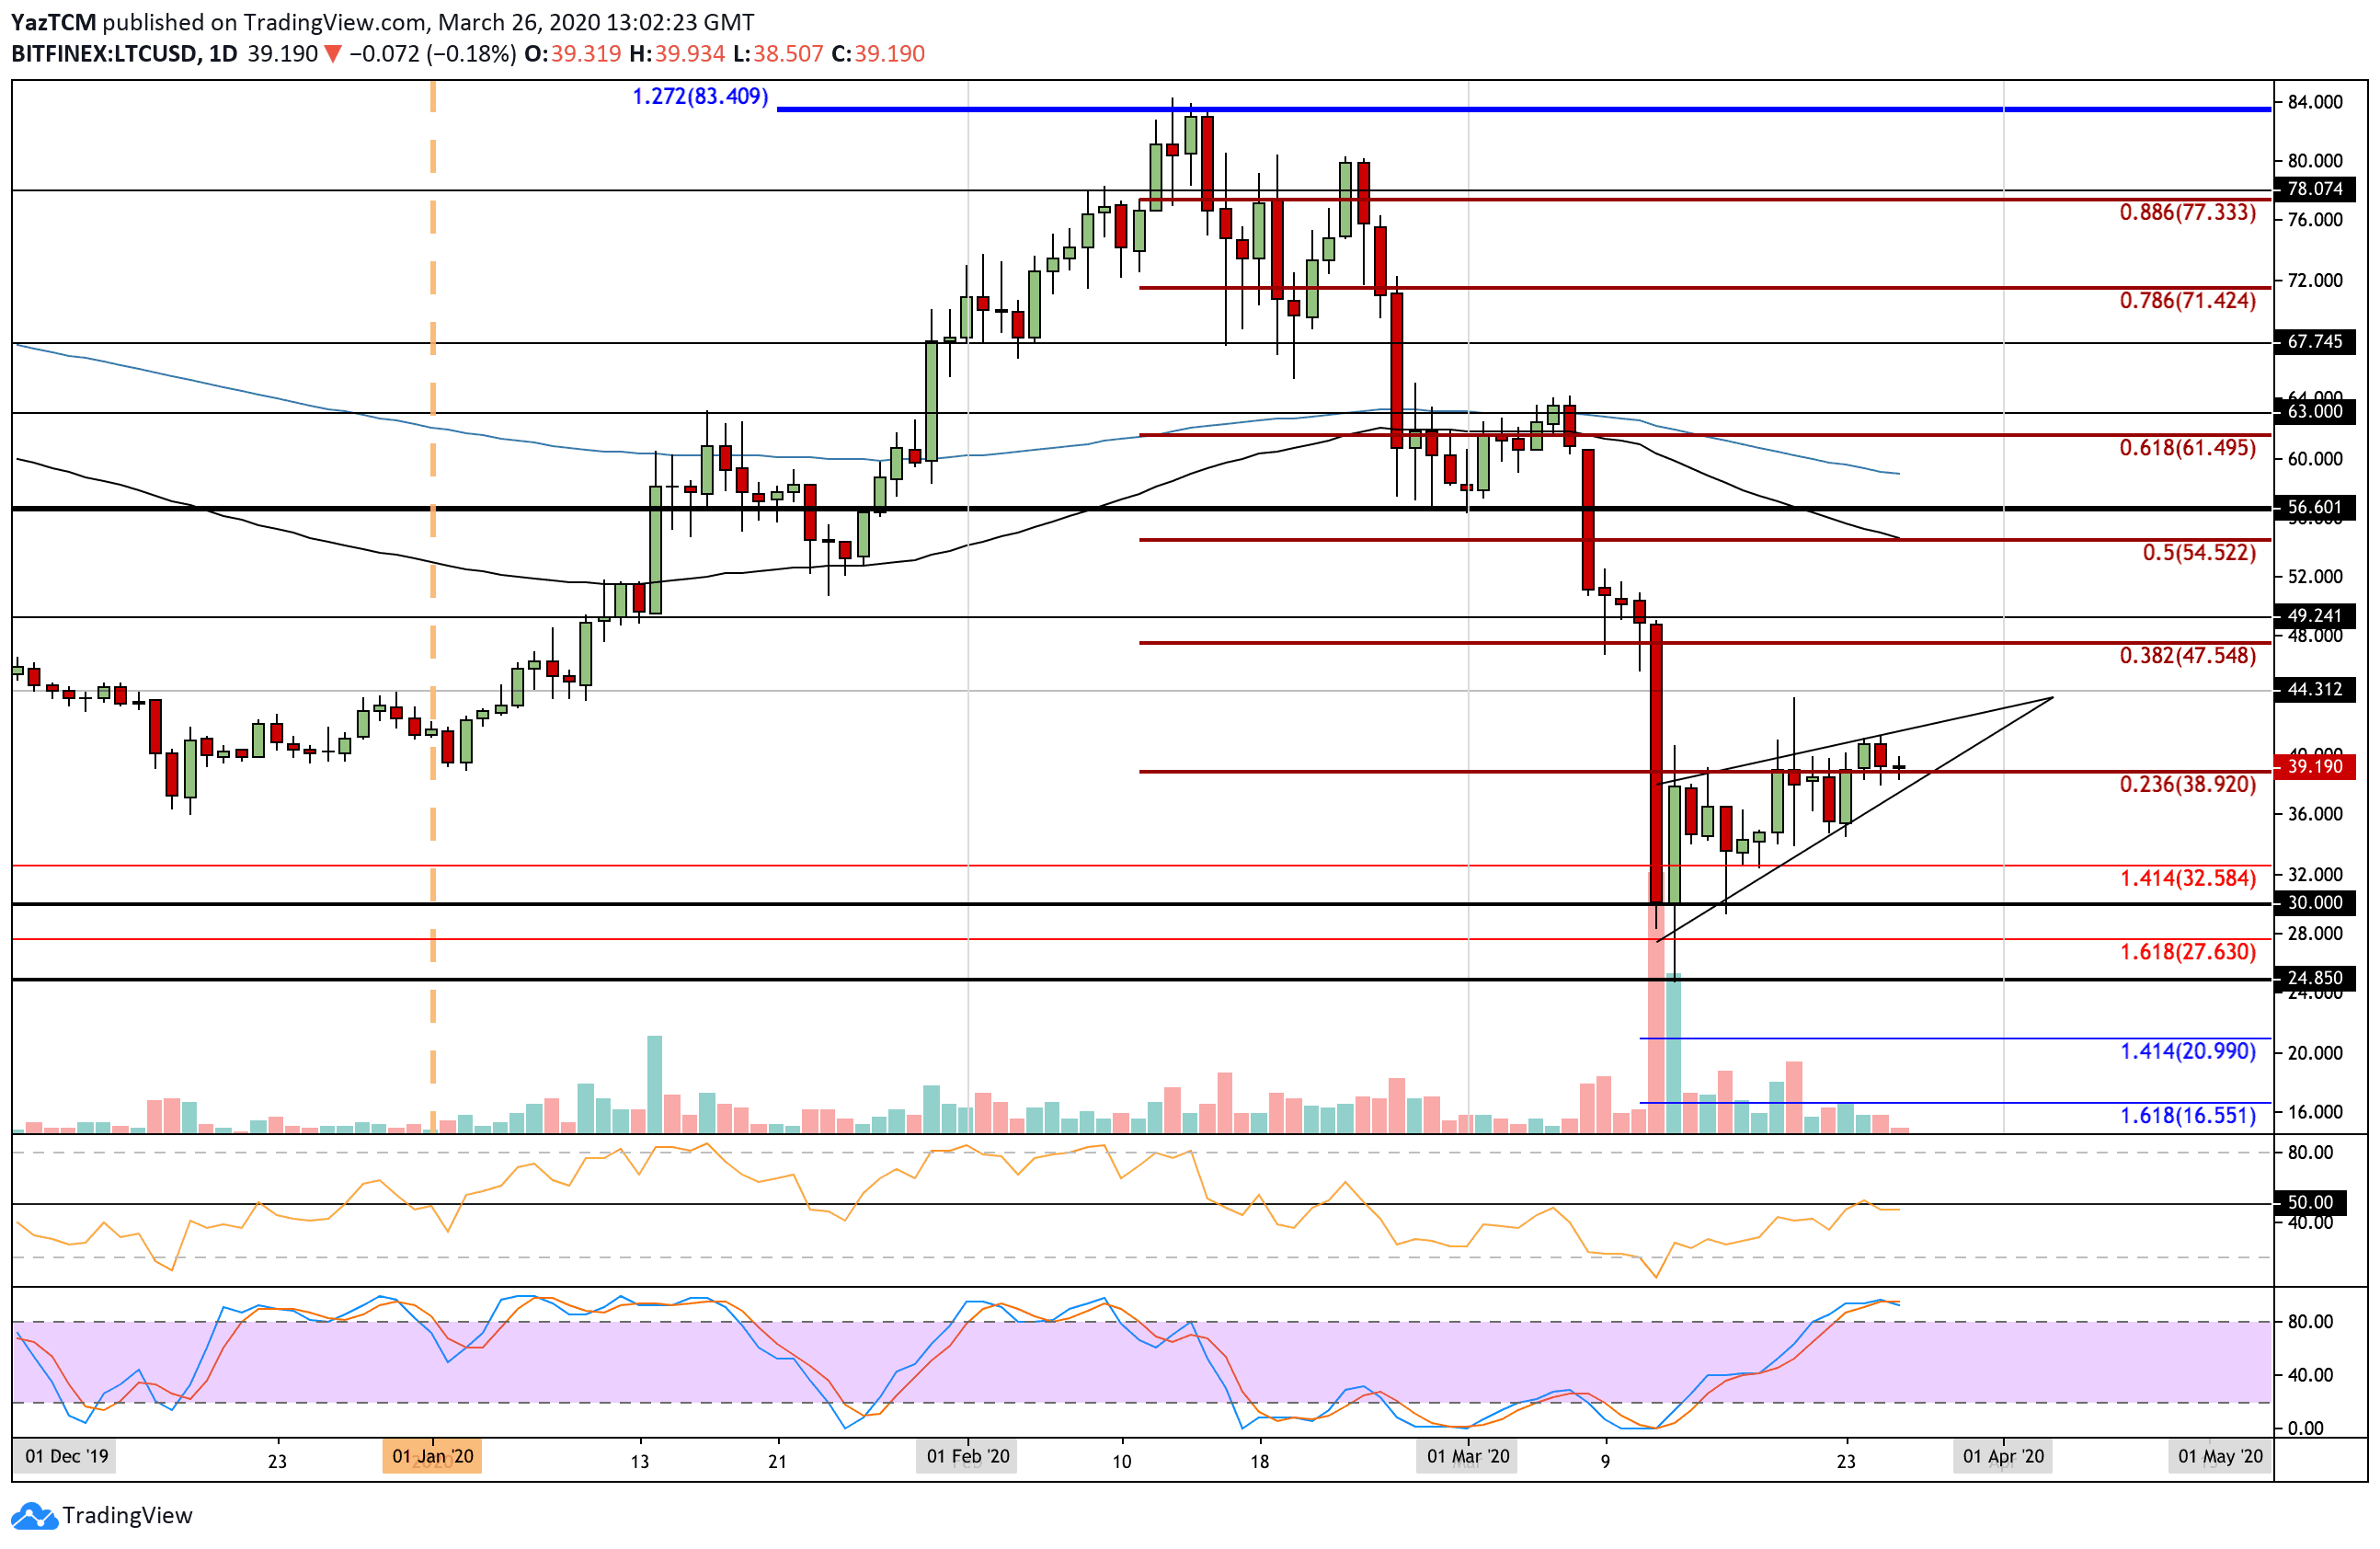
LTC-USD Short Term Price Prediction
If the buyers climb above $40, resistance lies at $42. This is followed by resistance at the upper boundary of the wedge. Above this, resistance is located at $44, $47.50 (bearish .382 Fib Retracement) and $50.
On the other side, if the sellers break $39, support lies at the lower boundary of the wedge. Beneath the wedge, support lies at $35, $32.50, and $30.
The RSI returned to the 50 level but is struggling to break above, which shows the bulls are still not in control over the market momentum. Additionally, the Stochastic RSI has produced a bearish crossover signal that might push LTC beneath the wedge.
LTC/BTC: Litecoin Creates Lower Closes Each Day
Against Bitcoin, Litecoin has been struggling for the past two weeks since rolling over from resistance at 0.0068 BTC (100-days EMA). It went on to drop beneath support at 0.0064 BTC and 0.0060 BTC to reach additional support at 0.0058 BTC, where it rebounded.
The cryptocurrency has continuously been making lower closes each day to show the weakness of the bulls within the market.
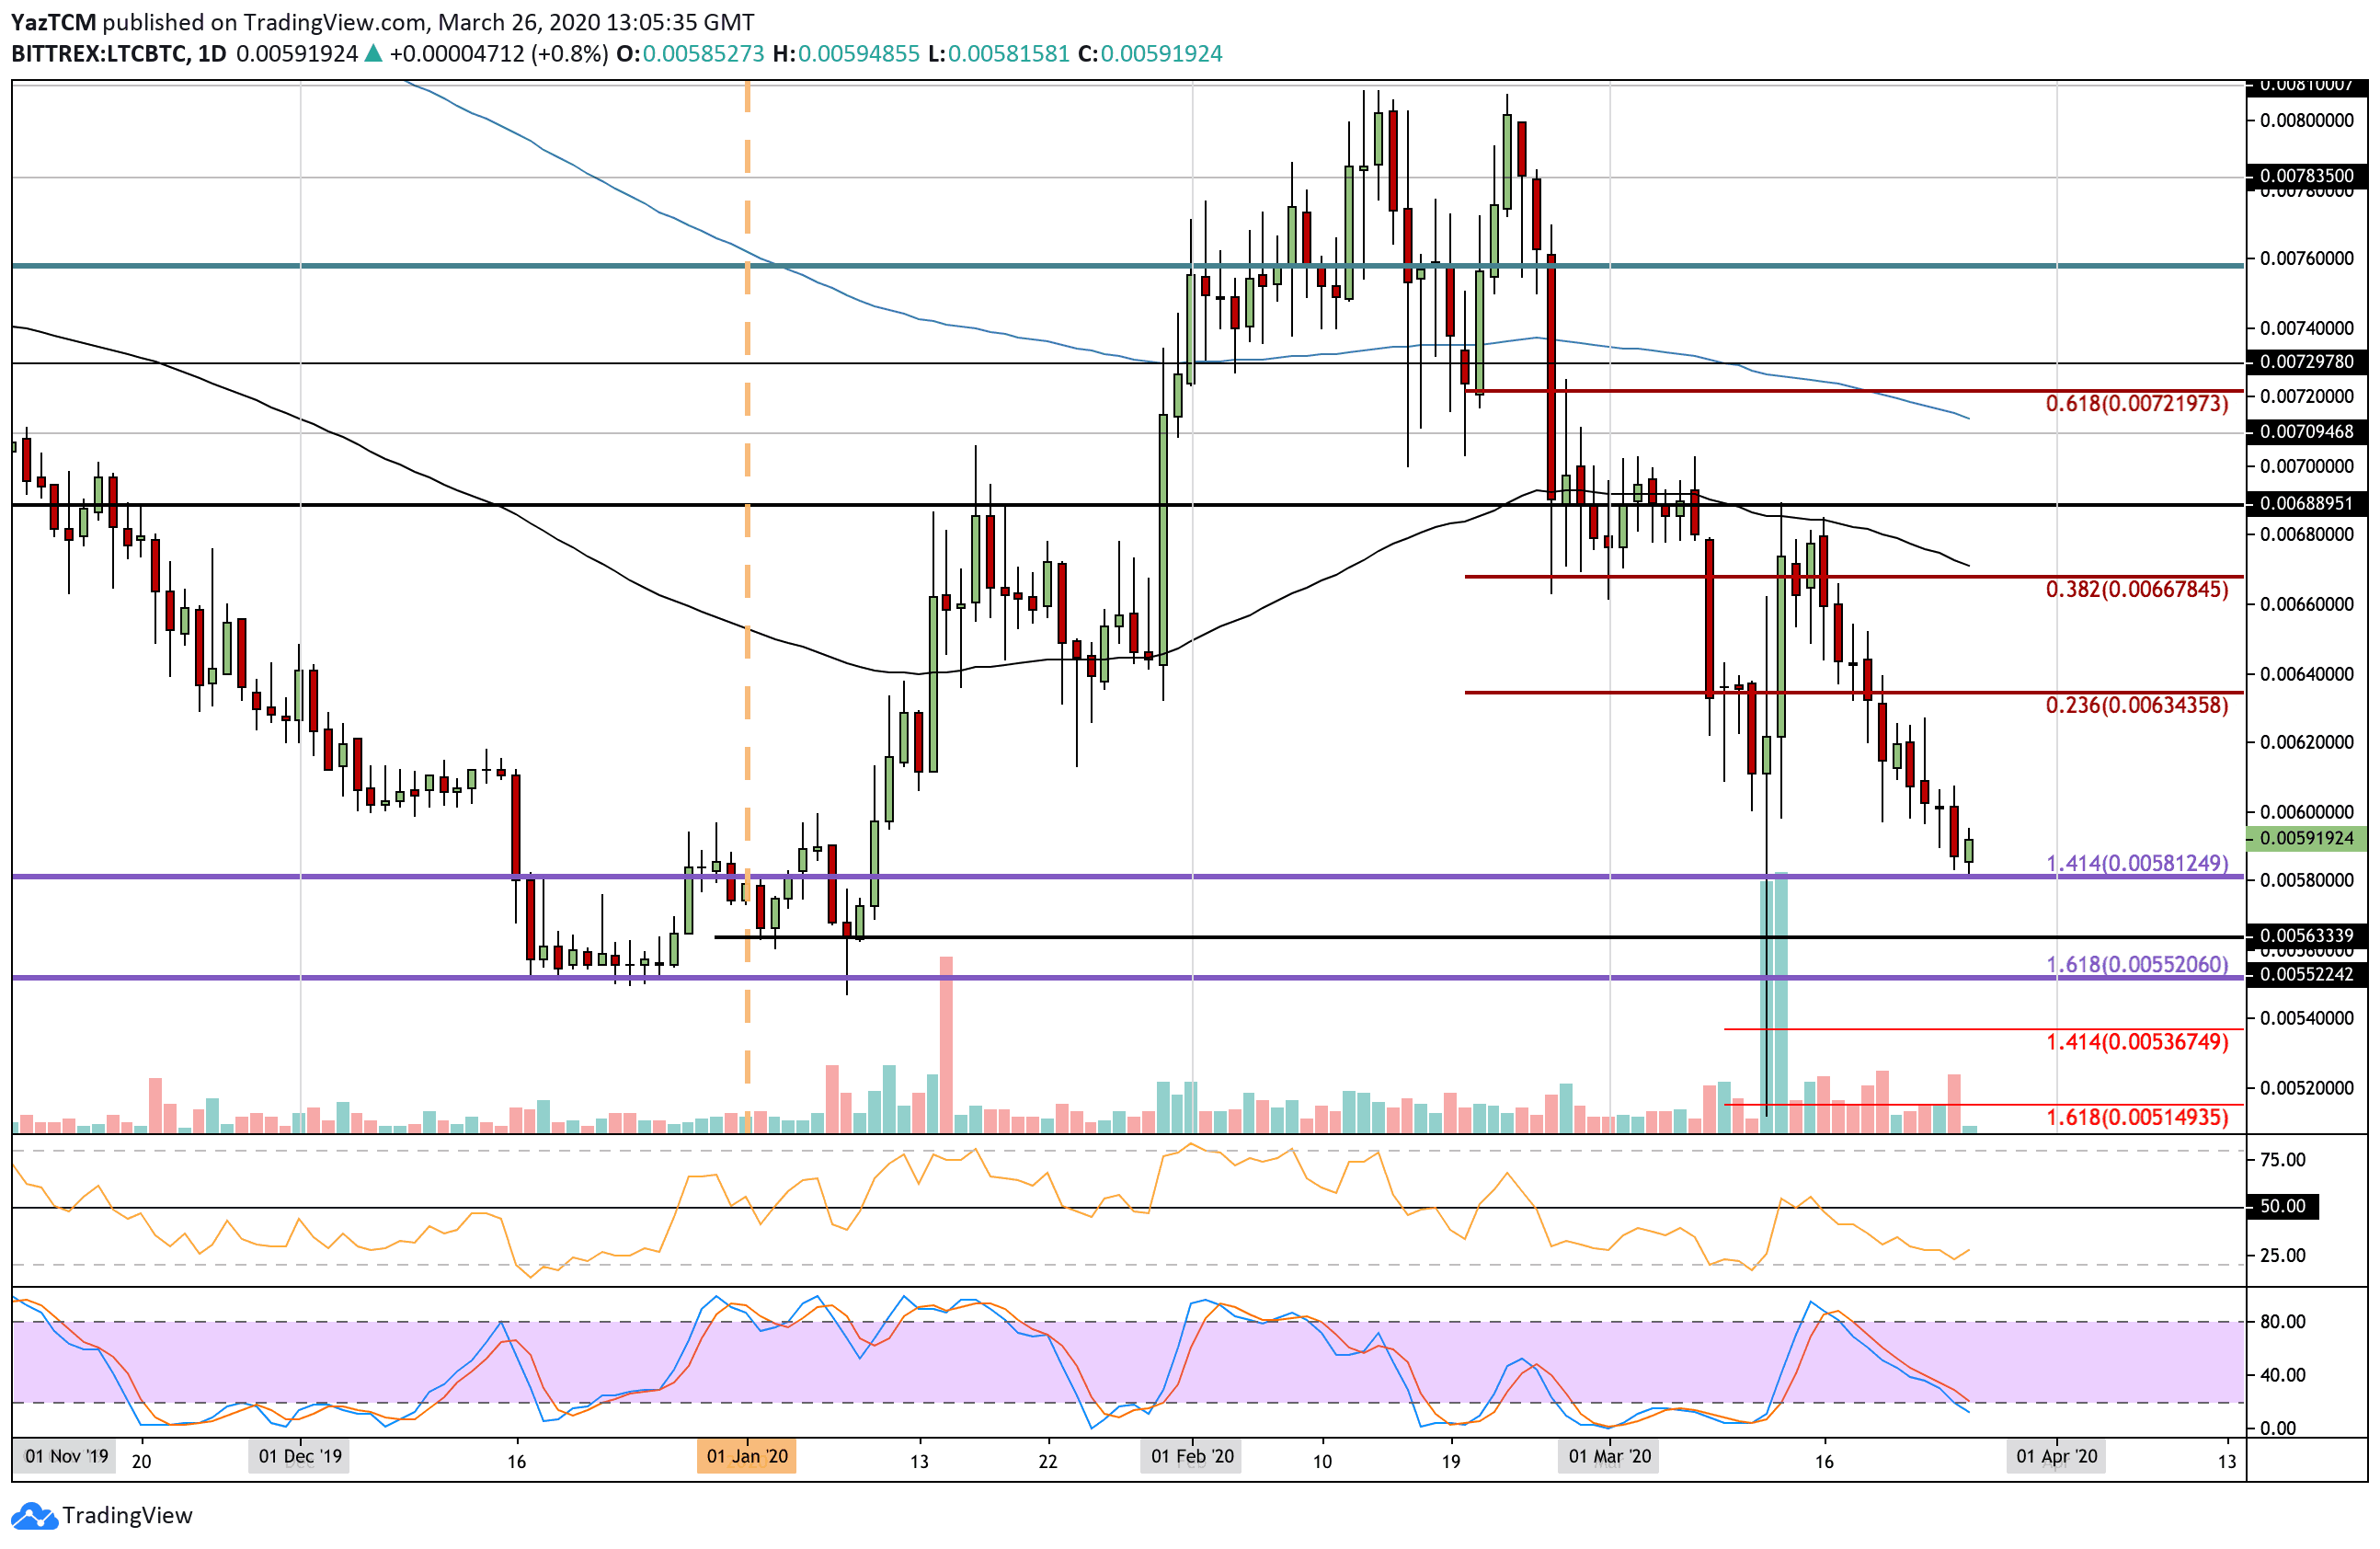
LTC/BTC: Short Term Price Prediction
If the bulls can push above 0.0060 BBTC, resistance lies at 0.0062 BTC and 0.00634 BTC (bearish .236 Fib Retracement). This is followed by resistance at 0.0066 BTC (100-days EMA) and 0.00688 BTC.
On the other side, the first level of strong support lies at 0.00581 BTC. Beneath this, support lies at 0.0056 BTC, 0.0055 BTC, and 0.00535 BTC (downside 1.414 Fib Extension).
The RSI rebounded from oversold conditions, which shows the selling momentum might start to fade. Additionally, the Stochastic RSI is quickly approaching oversold conditions, and a bullish crossover signal should help to send Litecoin higher.