Shiba Inu (SHIB) appears ready to extend its recent gains, as the daily technical technical setup suggests that the meme coin may be primed for a 30% rally. Also, key support levels and increasing buying pressure indicate favorable conditions for an upward move.
But can SHIB’s price rise higher than it has this week? This analysis looks at the possibility.
Shiba Inu Forms Cup-and-Handle Pattern
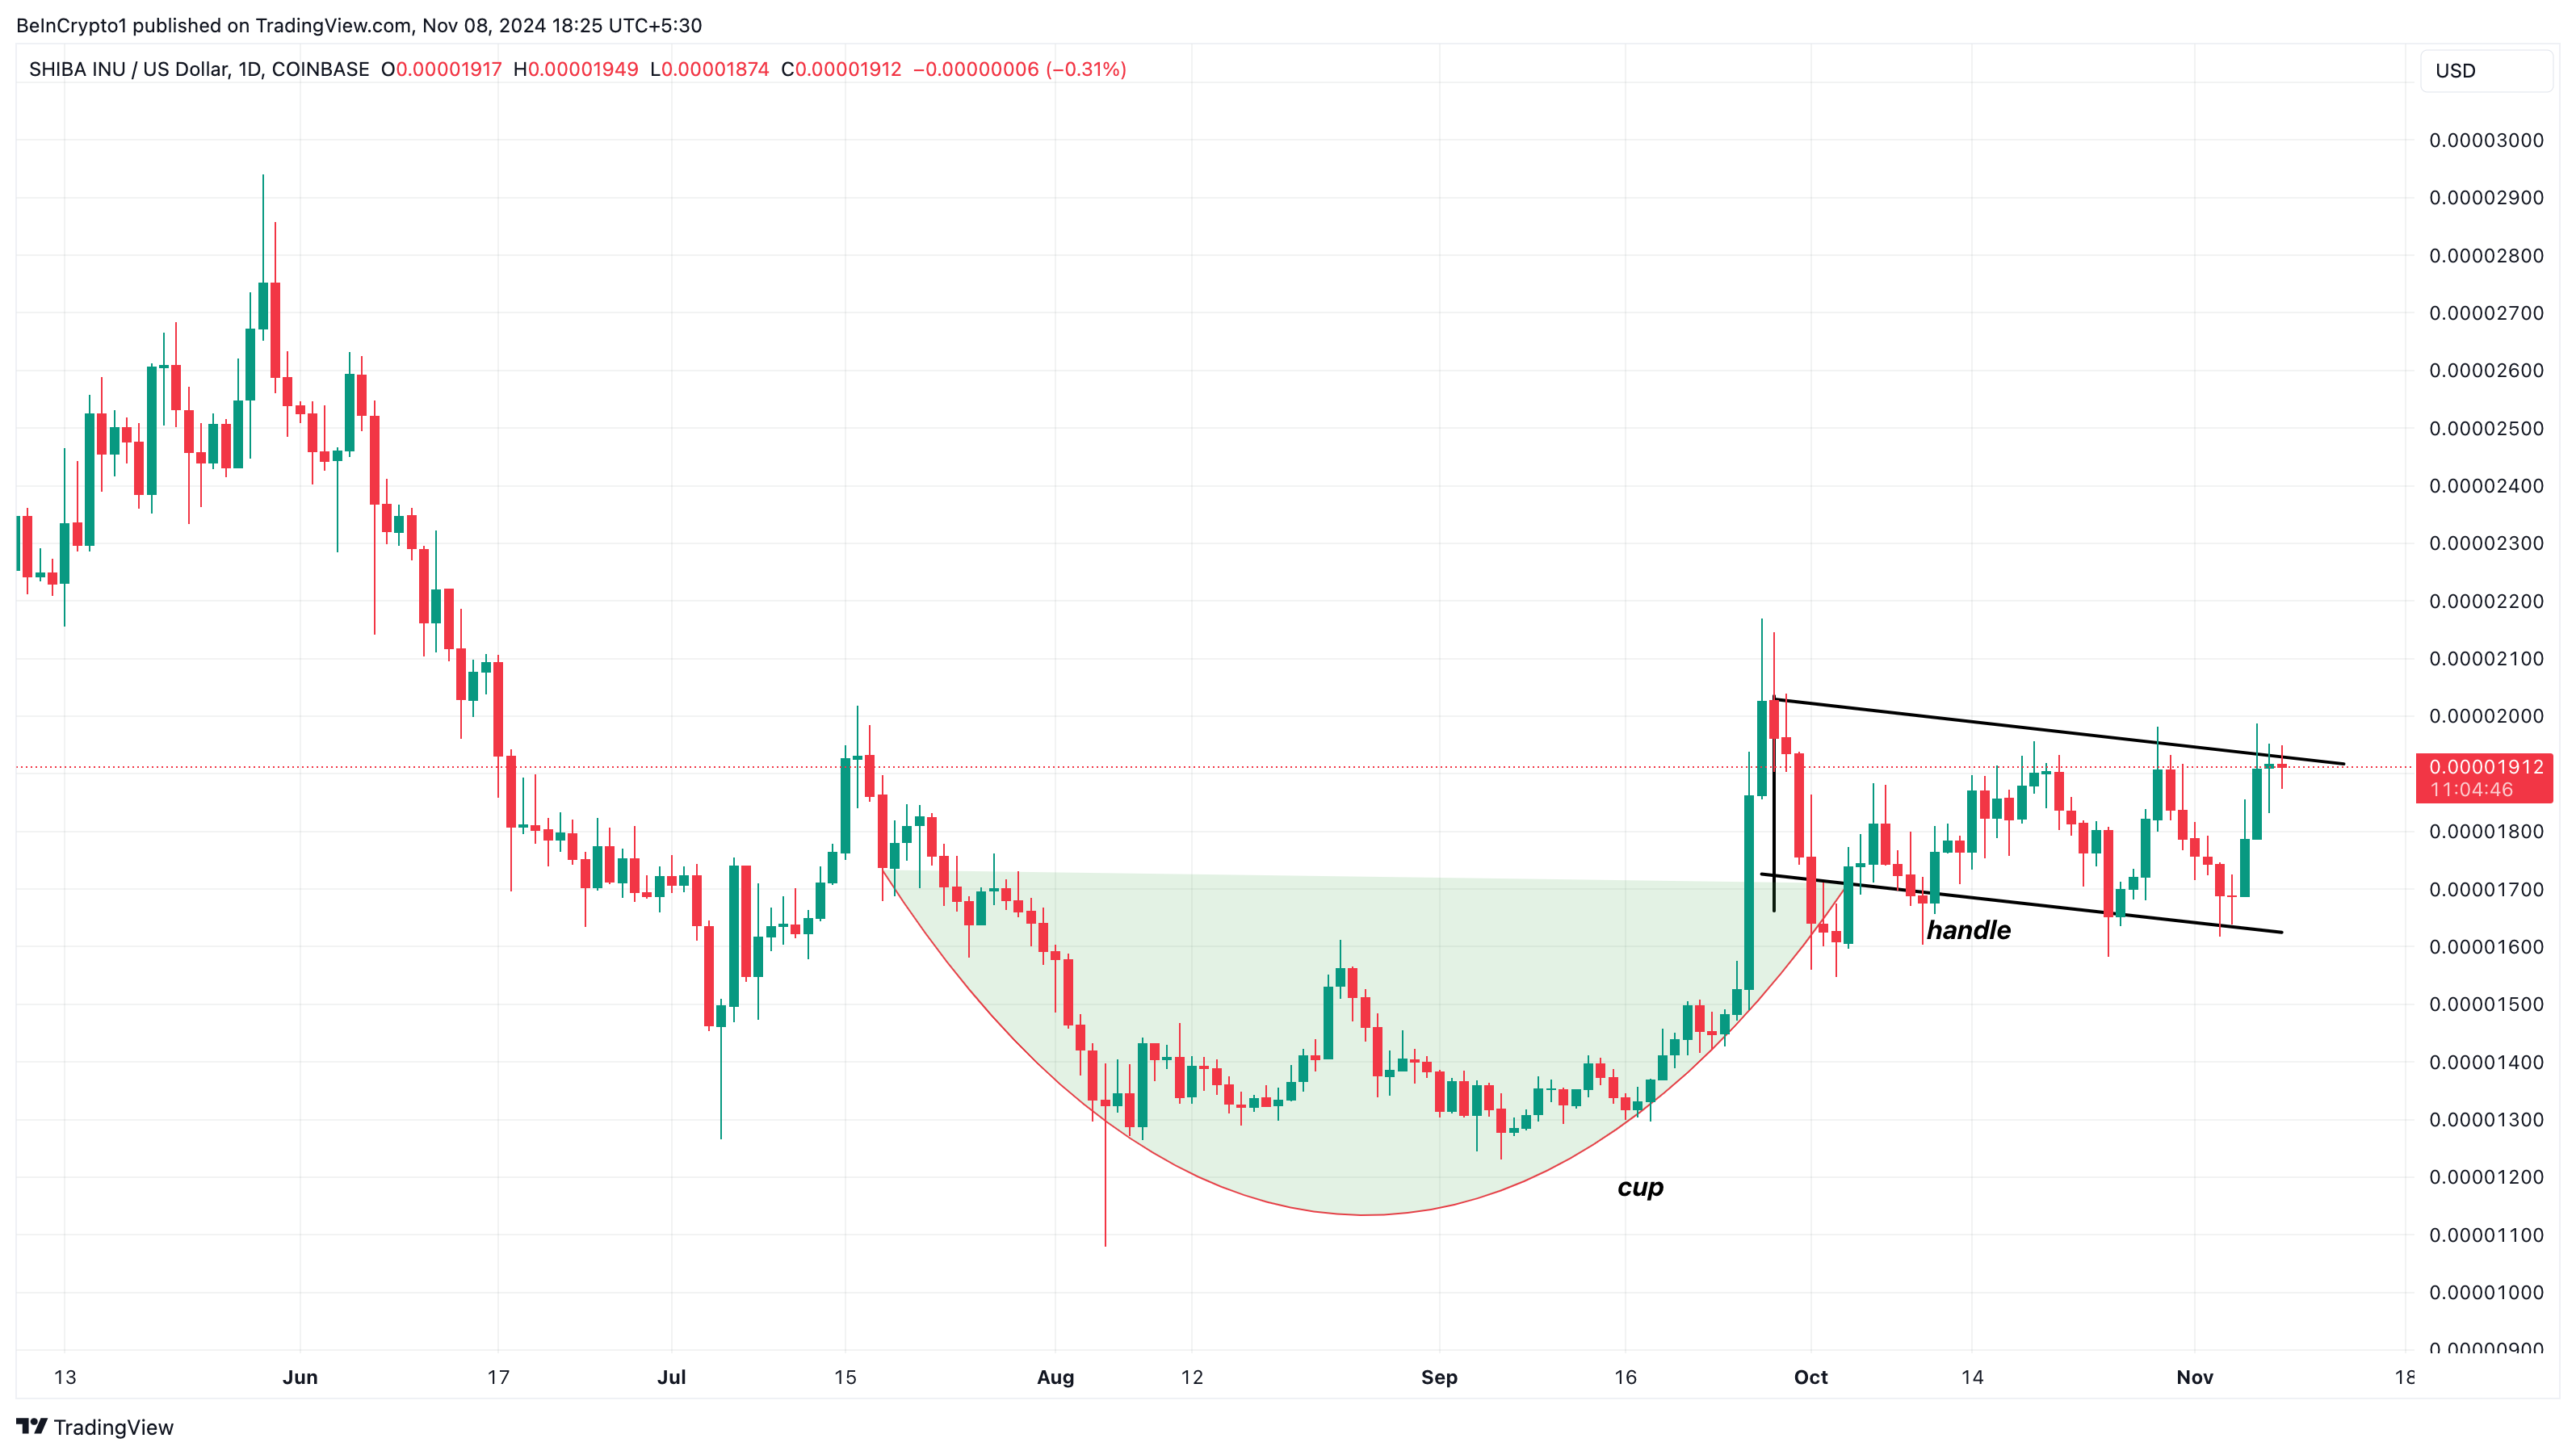
On the daily chart, BeInCrypto observed that SHIB has formed a cup-and-handle pattern. The cup and handle is a bullish technical chart pattern that resembles the shape of a “U” (the cup) followed by a slight downward drift (the handle). This pattern indicates the potential continuation of an uptrend.
As seen below, the SHIB technical setup shows that the meme coin formed the cup between mid-July and early October. During this period, the token moved between $0.000013 and $0.00018.
The handle, however, formed earlier last month and is still in place at the time of writing. This suggests that SHIB’s price could be ready for a significant breakout. Therefore, if buying pressure increases, the meme coin’s value might soar higher than $0.000019.

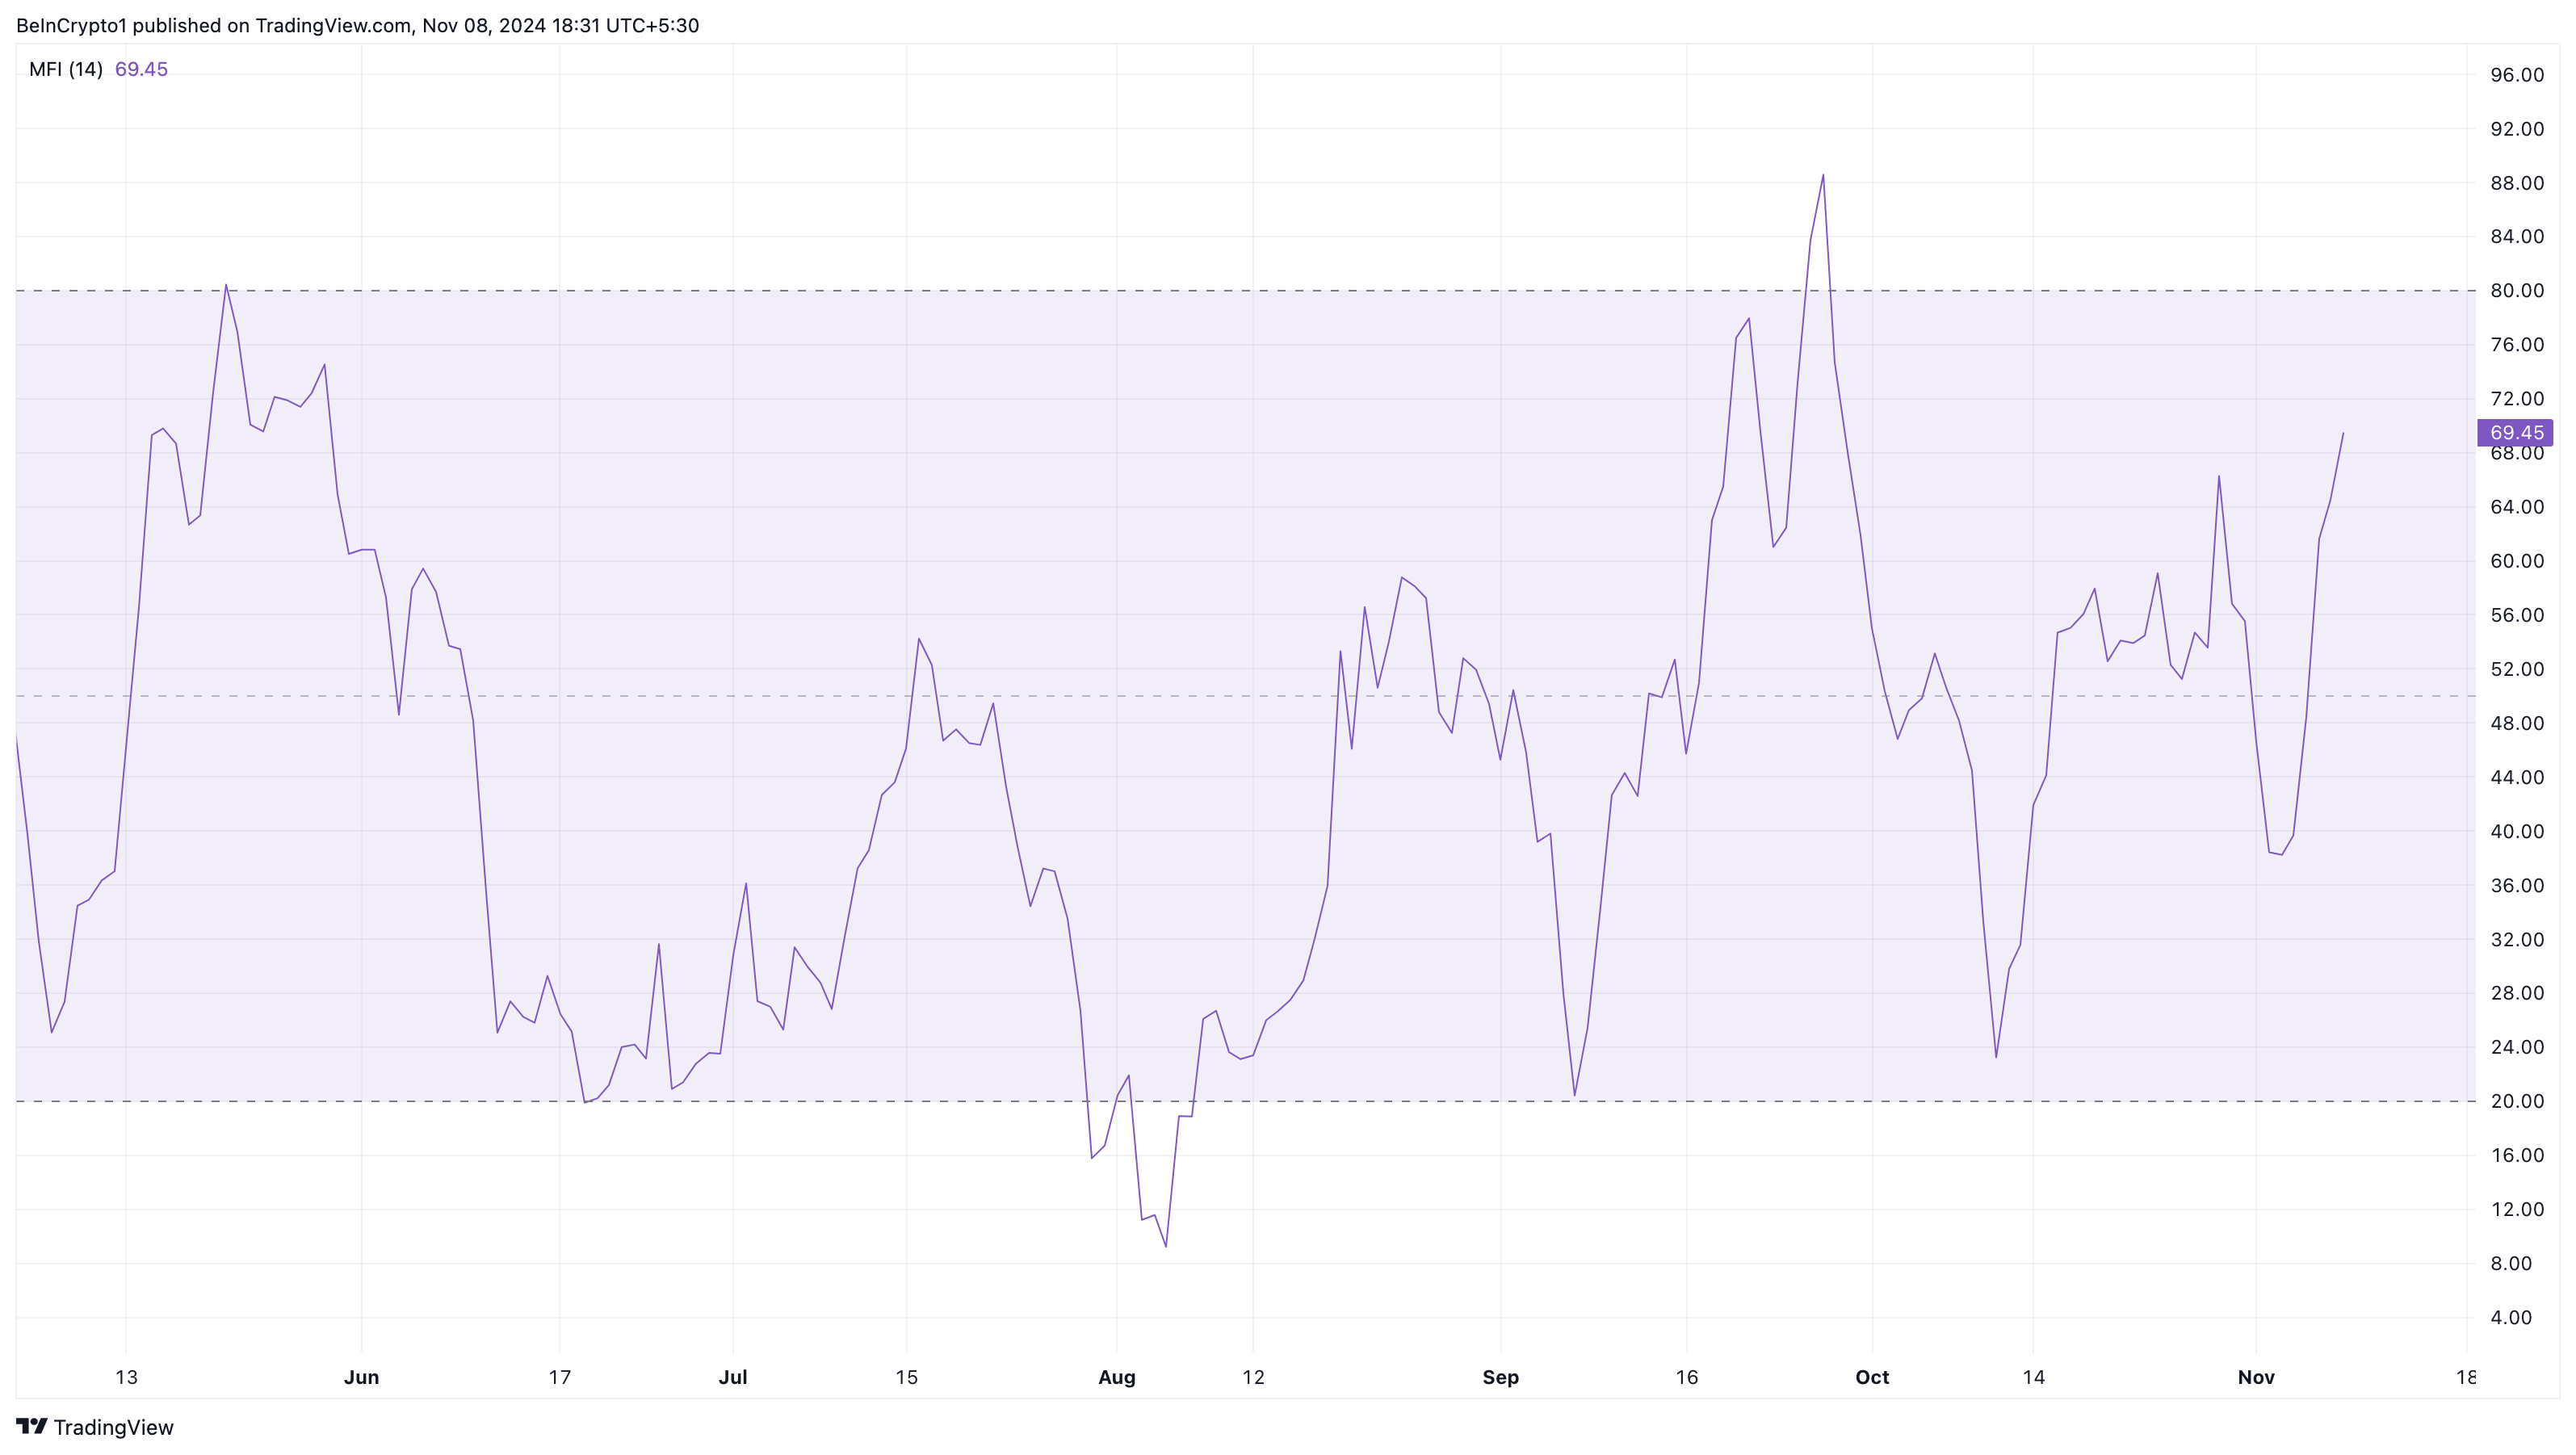
Meanwhile, the Money Flow Index (MFI) indicates growing buying pressure, further supporting the potential for a continued uptrend.
The MFI is a technical oscillator that combines price and volume data to assess an asset’s buying and selling pressure. It moves between 0 and 100, with values above 80 often indicating an overbought condition and values below 20 suggesting an oversold market.
When the MFI reading drops, it means that selling pressure is present. However, the indicator is currently rising, indicating that investors have resolved to buy SHIB. Hence, if this remains the same, the meme coin’s value might continue to rise.

SHIB Price Prediction: Target Aimed at $0.000025
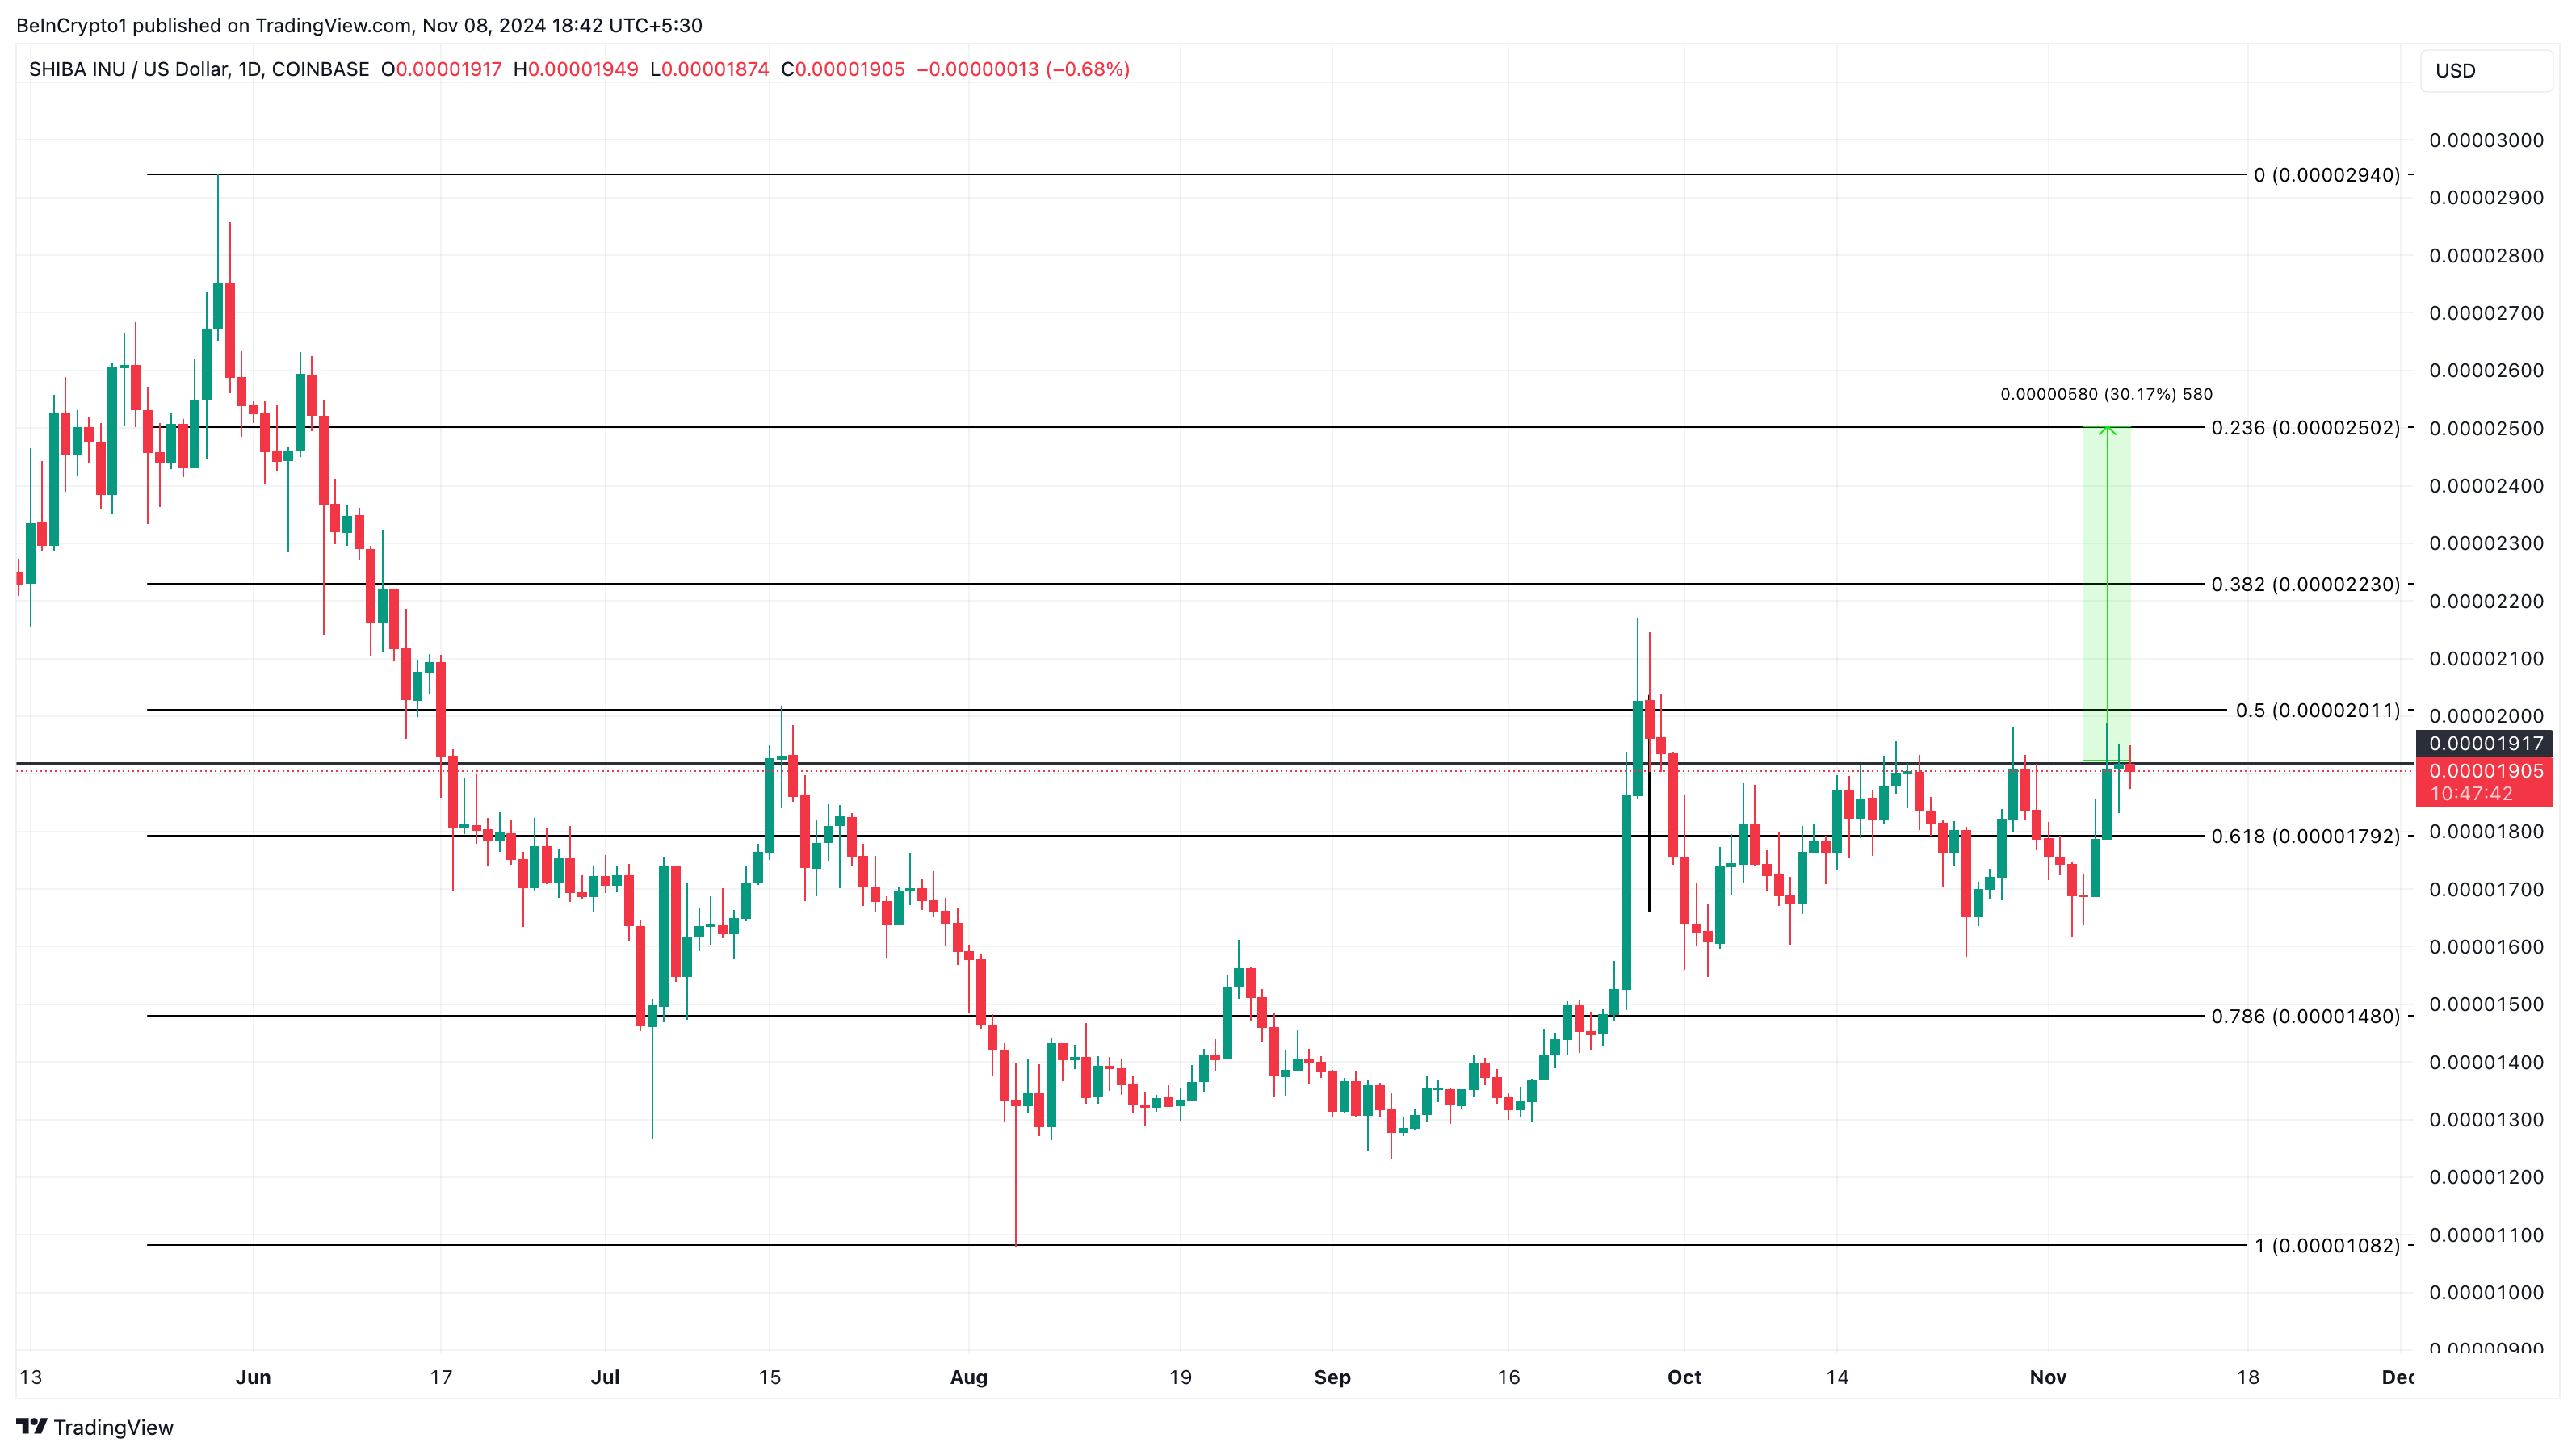
Another look at the daily chart shows that SHIB faces resistance around its current value. However, with the buying pressure indicated by the MFI, it can overcome the obstacle.
BeInCrypto also used the Fibonacci retracement index to analyze the extent to which the SHIB technical setup can take the meme coin.
Fibonacci retracement levels are horizontal lines drawn on a price chart to identify potential support and resistance levels. These levels correspond to key Fibonacci ratios (23.6%, 38.2%, 50%, 61.8%, and 100%).
If the price bounces off these levels, it suggests that the previous trend may continue in the same direction. As seen below, SHIB’s price has bounced off the 61.8% level. As such, the token’s price might increase by 30% to $0.000025.

On the other hand, if the token fails to breach $0.000020, this prediction might not come to pass. Instead, SHIB might drop to $0.000015.
 beincrypto.com