- Uniswap price analysis is bearish today.
- The strongest resistance is present at $19.6.
- The strongest support is available at $14.6.
Uniswap price analysis reveals that the market is currently following a massive downwards trend below the $16 mark and will likely maintain it. The price experienced a significant decline following its rise to the $16 mark on January 8, 2022, where the price went from $15.6to $16.1. However, the cryptocurrency could not maintain its value and fell to $14.5 on the same day. On January 9, 2022, the price gradually increased to $15.3, which is the current price for UNI/USD.
UNI/USD 4-hour price analysis: Closing volatility with bullish opportunities
The Uniswap price analysis indicates that market volatility follows a significantly decreasing trend, making Uniswap prices less vulnerable to volatile changes. The upper limit of the Bollinger’s band is available at $17.2, which acts as the strongest resistance for UNI. The lower limit for the Bollinger’s band is available at $14.6, which serves as another point of resistance rather than support for UNI.
The UNI/USD price appears to be crossing under the curve of the Moving Average, signifying a bearish trend. The UNI/USD price path appears to be moving upwards, which may indicate a reverse trend if the price can cross over the curve of the Moving Average.
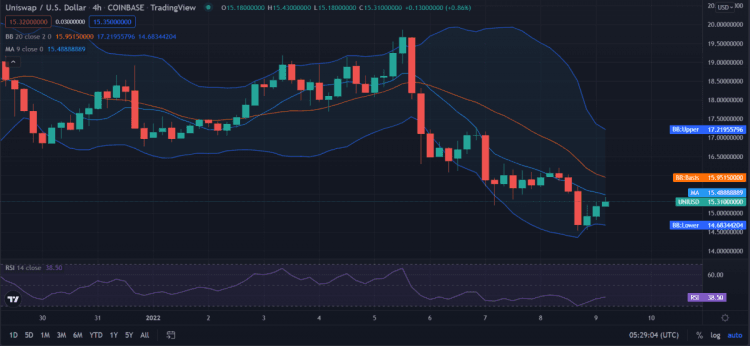
The Uniswap price analysis reveals that the Relative Strength Index (RSI) is 38, meaning UNI/USD shows no signs of being undervalued or overbought. The RSI score appears to be following an upwards movement caused by the buying activity outweighing the selling activity.
Uniswap price analysis for 1-day: Strong bearish dynamics
According to the Uniswap price analysis, market volatility is following a trend in decline, which means Uniswap prices are becoming less vulnerable to volatile changes. The upper limit of the Bollinger’s band is available at $19.6, which acts as the strongest resistance for UNI. The lower limit for the Bollinger’s band is available at $14.8, which serves as the strongest support for UNI.
The UNI/USD price appears to be crossing under the curve of the Moving Average, indicating a bearish trend. The UNI/USD price path appears to be moving well below the curve of the Moving Average, signifying a strong bearish momentum.
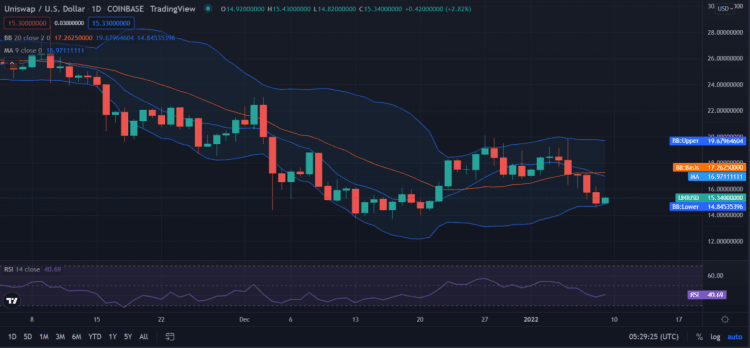
The Uniswap price analysis reveals that the Relative Strength Index (RSI) is 40, signifying a stable value for the cryptocurrency. This means the value of Uniswap falls neither on the overvalued category nor the undervalued slot. The RSI appears to be following a stable straight path which means the price of Uniswap isn’t likely to fall on either extreme. This also signifies that the buying activity is dominant in the market and may soon result in a reverse trend.
Uniswap Price Analysis Conclusion
Concluding the Uniswap price analysis, we deduce that the bears currently control the market, but the bulls are trying hard for a comeback, and the odds are in their favor. A reverse trend is inevitable. Uniswap price might undergo a significant incline in the coming days. Uniswap has shown a rocky bearish movement with massive fluctuations in the past few days. Still, finally, the figures and observations from the charts show us some hope for the cryptocurrency to bounce back and raise the value. The bulls are coming with everything they have and will likely seize the market soon.
Disclaimer. The information provided is not trading advice. Cryptopolitan.com holds no liability for any investments made based on the information provided on this page. We strongly recommend independent research and/or consultation with a qualified professional before making any investment decisions.