- Solana price analysis is bearish today.
- The strongest resistance is available at $207.
- The strongest support is present at $132.
Solana price analysis reveals the cryptocurrency following a bearish trend with the SOL/USD price declining in the past few days. On January 8, 2022, the price of SOL experienced a flash crash, and the price fell to $134; it declined further to $133; the market then reversed and regained some of its losses, and the price went up to $146; just shying away from the 148 mark. On January 9, 2022, the price of SOL again gradually declined and went to $142, which is the current price of Solana.
SOL/USD 4-hour price analysis: The market trend fluctuates steadily
The Solana price analysis of 4-hours revealed the market volatility following a declining trend, making SOL’s price less exposed to variable change. The upper limit value of the Bollinger’s band is available at $155, which acts as the strongest resistance for SOL. The lower limit value of the Bollinger’s band is present at $132, serving as the strongest support for SOL.
The SOL/USD price appears to be crossing over the curve of the Moving Average, signifying a bullish momentum. The bulls have recently taken the market, but it seems unlikely that they will be able to maintain their power for long.
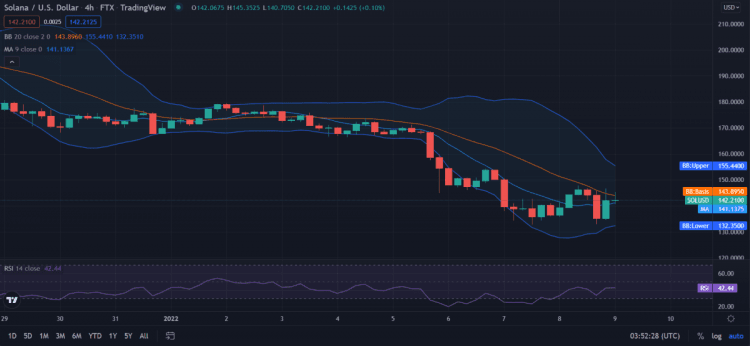
The Relative Strength Index (RSI) score is 42 showing the cryptocurrency to be stable, falling neither on the undervalued nor the overbought side. The RSI score appears to be following a straightforward, stable path which signifies the equivalence of the selling and buying activities.
Solana price analysis for 1-day: SOL experiences devaluation
The Solana price analysis shows the market volatility following a significantly increasing trend. The support and resistance bands move farther from each other, showing the degree of increment in the volatility. This reveals that the SOL/USD price has become more prone to experience variable change. The upper limit of the Bollinger’s band is present at $207, which serves as the strongest resistance for SOL. The lower limit of the Bollinger’s band is available at $135, which represents the strongest support for SOL.
The SOL/USD price appears to be crossing well under the curve of the Moving Average, signifying a bearish movement. The price path shows the SOL/USD price following an upwards direction that signifies the possibility of a reversal. The market has just come out of a breakout. Observing these figures, we can deduce that a reverse trend is imminent.
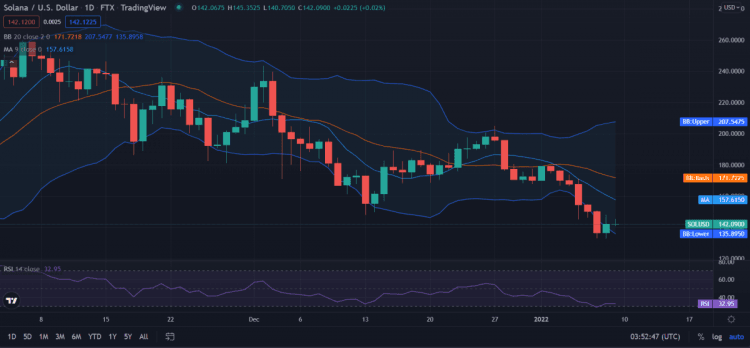
The Relative Strength Index (RSI) score is 32, revealing the cryptocurrency to be undervalued. The RSI score appears to follow a straight direction, indicating that the SOL/USD price remains constant. The buying activity equals the selling activity causing the RSI to remain steady.
Solana Price Analysis Conclusion
Observing the Solana price analysis, we conclude that the cryptocurrency follows a bearish trend. The bears have been ruling over the market for quite some time. All observations point towards a reversal trend.