- The Aave price analysis appears to be bearish.
- The strongest resistance is present at $301.7.
- The strongest support is present at $201.7.
The Aave price analysis reveals the cryptocurrency to be following a declining trend, where significant devaluation has been occurring for the past few days. The price of AAVE/USD had reached the $230 mark on January 6, 2022, before declining to $217 on January 7, 2022. The price suffered a flash crash on the same day, which further devalued the price. The price went from $217 to the $200 mark. Gradually the price has regained some value and has reached $208.
AAVE/USD 4-hour price analysis: Aave market expands volatility
The Aave price analysis has revealed the market volatility to be massive and following an increasing trend, making the price of the cryptocurrency more exposed to experience variable change on either extreme. The upper limit of the Bollinger’s band is present at $278, which serves as the strongest resistance. The lower limit of the Bollinger’s band is available at 4201, which represents the strongest support.
The AAVE/USD price appears to be crossing well under the curve of the Moving Average, indicating a strong bearish trend. The bears have dominated the market for a while, and now that the volatility has finally increased, it may give the bulls to return and reclaim the throne.
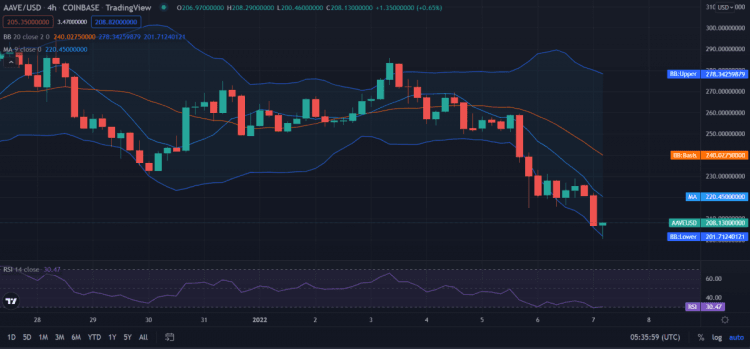
The Aave price analysis reveals the Relative Strength Index (RSI) to be 30, and this value indicates a relatively undervalued cryptocurrency. The RSI path appears to be following a straightforward, stable way which shows that the cryptocurrency shows no signs of being further devalued or attaining stability, for that matter.
Aave price analysis for 1-day: Te market shows negative momentum
The Aave price analysis shows market volatility following a dormant trend, not showing signs of increasing or decreasing. Although the volatility of the market is massive, it doesn’t seem to be following a declining or inclining trend. This means that the Aave prices subject to fluctuations will remain constant until the volatility shows signs of falling to either extreme. The upper limit of the Bollinger’s band exists at $301, which acts as the strongest resistance. The lower limit of the Bollinger’s band is available at $178, representing the strongest support.
The AAVE/USD price appears to be crossing under the Moving Average curve, indicating a strong bearish trend. The market remains bearish, with massive volatility. The AAVE/USD price path can be observed following a downwards movement.
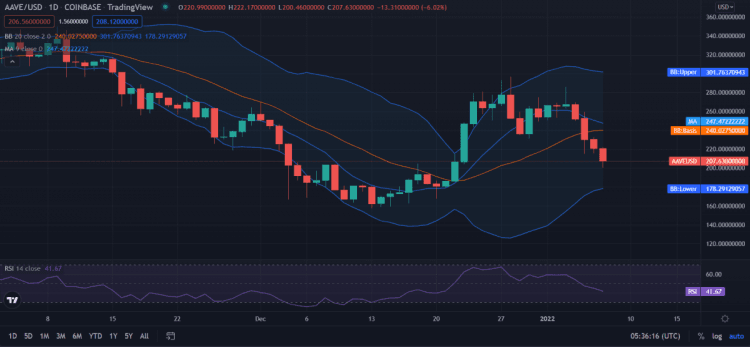
The Aave price analysis reveals that the Relative Strength Index (RSI) is 41, which means that the cryptocurrency shows no signs of falling to either extreme. The cryptocurrency currently belongs to neither the undervalued lot nor the overbought category. The RSI can be seen following a downwards movement that reflects a declining market trend and small chances of a reversal.
Aave Price Analysis Conclusion: AAVE/USD in a rut
The Aave price analysis concludes that the cryptocurrency follows a strong bearish trend. The price reached $232 on January 6, 2022; however, the price has been struggling even for the $210 mark now. The price has been on a decline ever since then. The current price of Aave is $208. The cryptocurrency is suffering from severe devaluation. The bears have gripped the market and are not keen on letting go quickly. This bearish trend will likely stay for a while.
Disclaimer. The information provided is not trading advice. Cryptopolitan.com holds no liability for any investments made based on the information provided on this page. We strongly recommend independent research and/or consultation with a qualified professional before making any investment decisions.