- Theta price analysis is bearish today.
- Strong resistance is found at $4.7.
- Strong support is present at $4.15.
The Theta price analysis reveals that the price has been following a downward movement for the past few days, as the bears have been continuously at the lead, and the price function is headed downwards. The short-term price trend line is also descending as a regular decline in price has been taking place since 27th December. The price has been lowered down to the $4.37 level as a result of the latest bearish strike. Further downfall in price is to be expected in the coming hours as well.
THETA/USD 1-day price chart: Bears maintain a downwards trend
The 1-day Theta price analysis shows the token has traded in a range of $4.49 to $4.15 today, while the token is trading hands at $4.37 at the time of writing. Theta has lost a value of 15.81 percent over the last 24 hours and is at a loss of 12.56 percent over the past week, as the trend was downwards for the past two weeks. On the other hand, the trading volume has increased by more than 21 percent resulting in the market dominance of 0.21 percent, but the market cap has decreased by 14.72 percent.
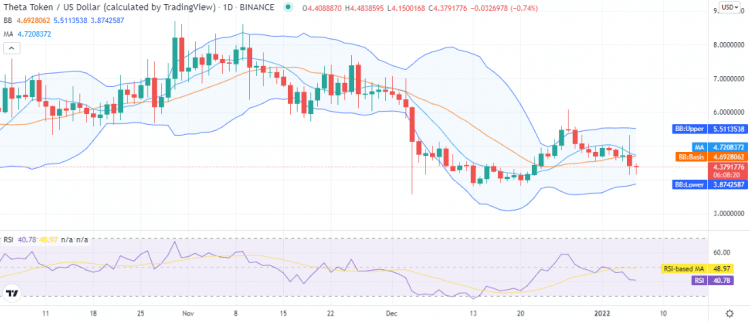
The SMA 20 curve has been traveling higher than the SMA 50 curve, but now the SMA20 is soon going to travel below the SMA50, which is yet another confirmation of the bearish trend. The volatility is high, with the upper Bollinger band value at $5.51 and the lower Bollinger band value at $3.38. The Relative Strength Index (RSI) score has dropped down to index 40 level as well.
Theta price analysis: Recent developments and further technical indications
A considerable decline in THETA/USD price has been observed since yesterday. The price has gone below the $4.45 support as well, as a result of the constant bearish pressure. The latest downturn in price has lowered it to the $4.37 level, which has proved to be quite damaging for the overall token value.
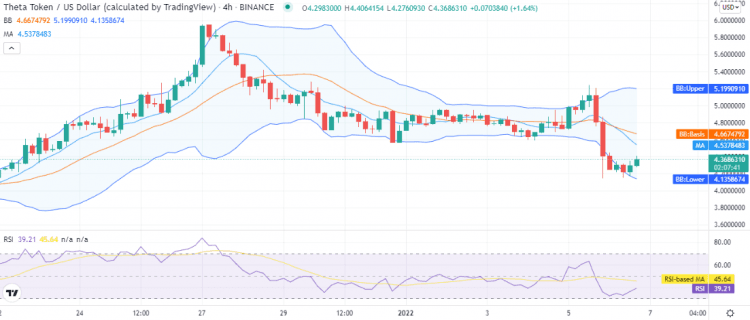
A crossover between SMA 50 and SMA 20 took place earlier yesterday, and as a result, SMA50 is now trading higher than SMA20 on the 4-hour chart. Now the Bollinger band’s average is at $4.66 point, whereas the upper Bollinger band is resting at $5.19, and the lower Bollinger band is at $4.13. The RSI curve has covered an upwards movement during the last eight hours, and the score is now touching index 39 after hovering near the undersold zone.
Theta price analysis: Conclusion
The one-day and four hours Theta price analysis is confirming a downtrend for the day, as the price has undergone a significant decrease in the last 24-hours. Bears have been leading the price charts for the past few days, and even today, a downward tendency has been shown by THETA/USD. The recent bullish efforts are hopeful, but a further decrease in price is also expected during the coming hours.
Disclaimer. The information provided is not trading advice. Cryptopolitan.com holds no liability for any investments made based on the information provided on this page. We strongly recommend independent research and/or consultation with a qualified professional before making any investment decisions.