- The Tezos price analysis is bearish today.
- Support for XTZ is present at the $4.30 level.
- Resistance is present at $4.74.
The Tezos price analysis is bearish as the cryptocurrency observed a significant level of devaluation during the last 38 hours. Bears engulfed the market yesterday when the coin value fell from $5.0 and capped at $4.5 yesterday; bears continued ruling the market today as well as a further decrease in price was recorded. The bearish momentum was aggressively strong yesterday and even at the start of today’s trading session, but bullish activity was also observed later today, and bulls have recovered quite a chunk of price value as they continued defining the price function during the last four hours also.
XTZ/USD 1-day price chart: Price steps further down
The 1-day Tezos price analysis shows the coin price has decreased today as well as XTZ price has stepped down to $4.47 at the time of writing, reporting a 15.8 percent loss of value over the last 24 hours, and also reports a decrease in price value up to 2.19 percent over the past week. The trading volume has also decreased by 17.26 percent, and the market cap decreased by 15.89 percent over the last day.
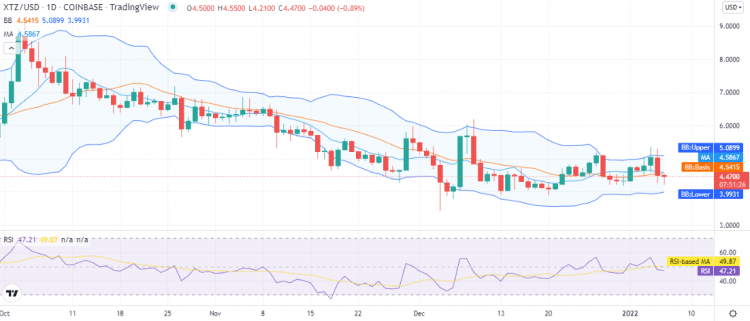
The volatility has been mild, which is why the upper Bollinger band value is at $5, and the lower Bollinger band value is at $3.99, representing support for XTZ. The Relative Strength Index (RSI) score is going down as well because of the selling activity and is present at index 40.
Tezos price analysis: Recent developments and further technical indications
The 4-hours Tezos price analysis is showing bullish signs as the price has recovered significantly after dipping low. There has been a continuous decrease in the price yesterday and at the start of today’s trading session as well. However, bulls have made a comeback, and a change in trend is taking place as the price is covering an upwards range at present.
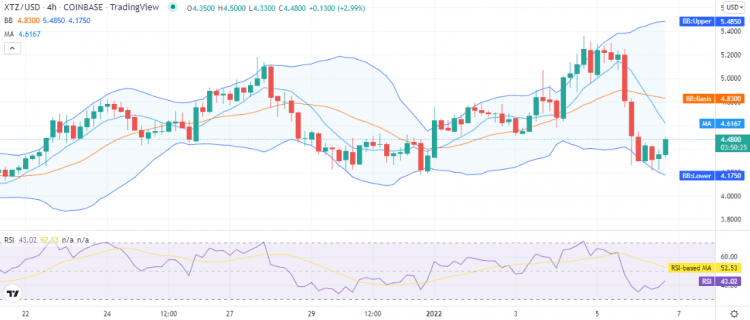
The Bollinger Bands Indicator is expanding vastly as it shows increasing volatility on the 4-hour chart. The upper value of the indicator is at the $5.4 mark, whereas the lower value is at the $4.17 mark. The RSI score, after going quite low, has started to recover, and the indicator is currently trading at index 43, indicating the buying activity in the market.
Tezos price analysis conclusion
The Tezos price analysis suggests that the price level is still on the lower side hence in the bearish dominance, but the reversal in trend is also quite impactful as bulls have recovered a good percentage of today’s loss. Though the price function is still under the bearish shadow, we expect XTZ/USD to recover further in the coming hours.
Disclaimer. The information provided is not trading advice. Cryptopolitan.com holds no liability for any investments made based on the information provided on this page. We strongly recommend independent research and/or consultation with a qualified professional before making any investment decisions.