- Polkadot price analysis is bearish today.
- Resistance for DOT/USD is present at $27.4.
- Support for DOT/USD is present at $25.4.
The Polkadot price analysis is bearish as it shows the coin went through a severe devaluation in the recent bearish slide. The price is headed down today as well as the bearish momentum has been revived in the past few days. A downward price movement was observed today as well, as the market has turned completely bearish. The bearish momentum has proved to be quite overwhelming for the bulls, as non of the previous supports have worked for them. The price has taken an unexpected downturn to $26 and might move further down to a new low in the coming week.
DOT/USD 1-day price chart: DOT is looking to step into the $25 range
The one-day Polkadot price analysis confirms that a bearish trend has been at its peak for the past few days. The DOT/USD price has stepped further down and is trading hands at $26.2 at the time of writing. The crypto pair reports a loss value of 12.91 percent over the last 24 hours, and DOT also reports a loss in value of 5.46 percent over the past week. The trading volume has increased by 46.94 percent, but it composes of selling mostly. The market cap has decreased by 12.74 percent in the last 24 hours, resulting in a market dominance of 1.26 percent.
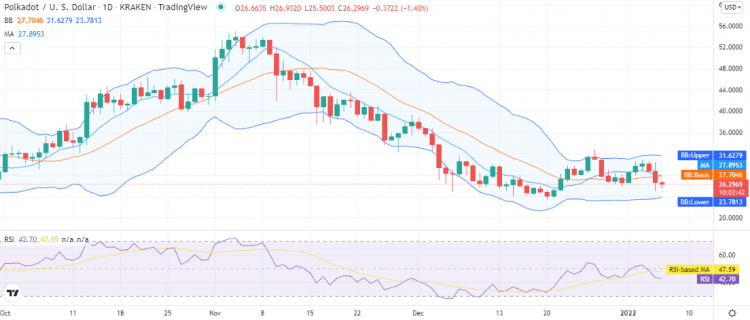
The volatility remains low comparatively, with the upper Bollinger band present at the $31 mark, whereas the lower Bollinger band is present at the $23 mark representing the strongest support for DOT. The Relative Strength Index (RSI) score has been degraded to index 42 as well due to the constant selling pressure.
Polkadot price analysis: Recent developments and further technical indications
The 4-hour Polkadot price analysis shows the price has dropped further today after breaking downwards. But some bullish efforts were also observed during the late-night and even during the last four hours as well when bulls tried to elevate the price function, but the trend is still in favor of the bears as the price has reached the lower price envelope of $26 range.
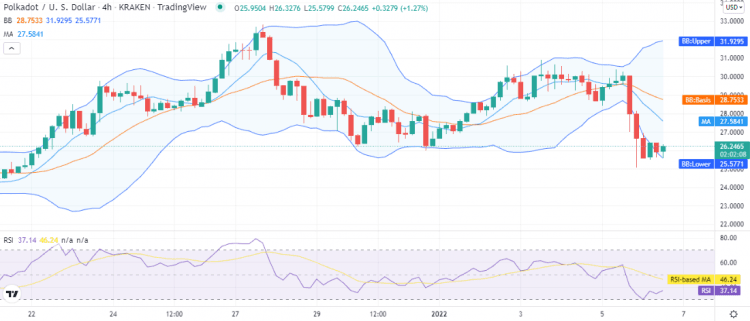
A crossover between SMA 50 and SMA 20 curves resulted because of the significant fall in price earlier yesterday. The Bollinger bands Indicator shows increasing volatility on the 4-hour chart as the Bollinger bands are expanding. The upper value of the indicator is at the $31.9 mark, whereas the lower value is $25.5. The RSI score is now critically low near the under-bought limit at index $37.
Polkadot price analysis conclusion
The Polkadot price analysis confirms that the price has undergone a decline during the day. The price is now touching the $26.2 mark, and it can be expected that it will move down to further lows in the approaching week. However, the hourly chart supports the bulls, as the price has been elevated in the last four hours as a result of bullish efforts.
Disclaimer. The information provided is not trading advice. Cryptopolitan.com holds no liability for any investments made based on the information provided on this page. We strongly recommend independent research and/or consultation with a qualified professional before making any investment decisions.