- Polkadot price analysis shows that price lowered more than 3 percent to $28.58 over the past 24 hours
- DOT in line for another attempt at a 30 percent rise up to $36.89
- $26.23 support floor also remains in touching distance which will invalidate the bullish thesis
Polkadot price analysis for the day shows price dropping more than 3 percent on the day to sit at $28.58 after observing majority sell offs yesterday. DOT will look to relaunch towards $36.89 to record a 30 percent increment, but is set to face resistance at the $32.78 hurdle. Price rose 17 percent from December 31 to January 3 to set at $30.88, before receding down to $29.07 at the start of today’s trade. The support floor is set at $26.23, which remains in touching distance at the current trend. From here, a retest would provide DOT the bullish impetus to kickstart another rally.
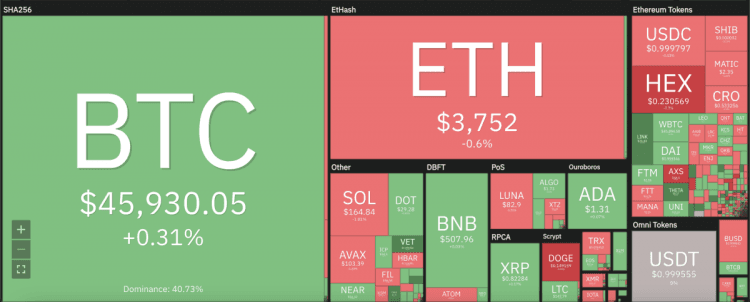
The larger cryptocurrency market showed mixed results over the day’s trade, as Bitcoin lowered into the $45,000s with Ethereum also dropping below $3,800. Terra dropped 3 percent to $82.61, similar to Solana’s 2 percent dip down to $164.29. Ripple and Litecoin recorded minor increments, while Dogecoin recorded the biggest loss, retracing 11 percent down to $0.149.
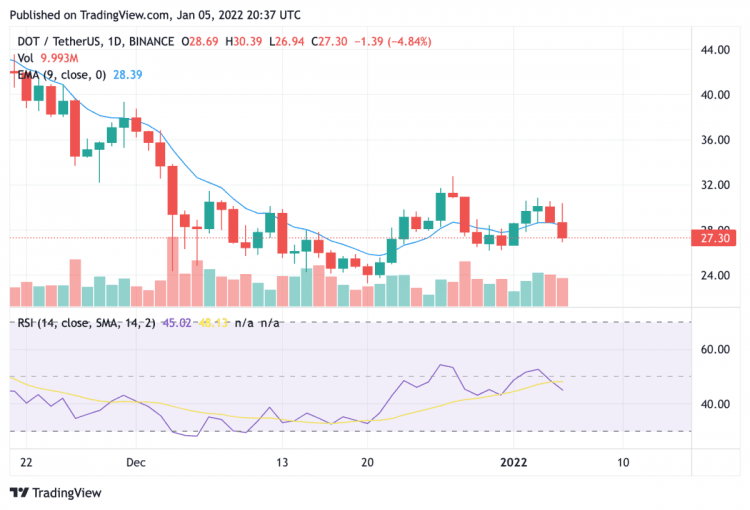
DOT/USD 24-hour chart: Price dips sharply nearing $26.23 support
The 24-hour chart for Polkadot price analysis shows price taking a sharp turn to decline towards the $26.23 support floor. In doing so, DOT moved below its crucial 50-day exponential moving average (EMA) whereas the relative strength index (RSI) shows an undervalued market status with a reading at 45.12. It is expected that price may kick on from the support zone, however if buying pressure succumbs to selling DOT may head towards the previous support zone of $24.05.
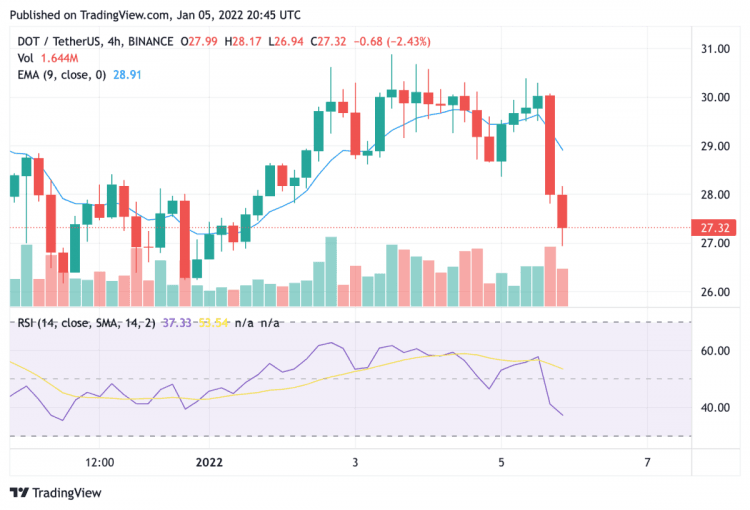
DOT/USD 4-hour chart: Inverted hammer pattern shows dominant selling trend
On the 4-hour candlestick chart for the DOT/USD trade pair, price can be seen declining sharply over the past few trading sessions. The RSI value has dropped down to a meagre 37.85 with price falling well below the 4-hour EMAs at $28.94. At current trend, price is set to be headed towards the previous support floor at $24.05 and is likely to push upwards from there. Buyers are expected to come into the market for DOT as the discounted buying opportunity to come.
Disclaimer. The information provided is not trading advice. Cryptopolitan.com holds no liability for any investments made based on the information provided on this page. We strongly recommend independent research and/or consultation with a qualified professional before making any investment decisions.